May 5, 2026

By David Heacock
Since the start of the COVID-19 pandemic, economic observers—and many frustrated aspiring homebuyers—have commented extensively on the extremely competitive market for housing. For many middle class households, savings rates increased while much of the economy was shut down last year, while federal stimulus has enabled strong stock market returns and low mortgage interest rates. These factors have brought a flood of people into the real estate market looking to buy or upgrade their homes.
Unfortunately for these would-be buyers, the market has not seen a commensurate increase in inventory, as available housing stock reached record lows earlier in the pandemic. Living space took on new value during the pandemic, and the prospect of looking for a new home in such a competitive market discouraged many would-be sellers. As a result, many homeowners elected to stay put even with such a strong sellers’ market. The result has been record-low inventories and record-high prices for the homes that do make it to sale.
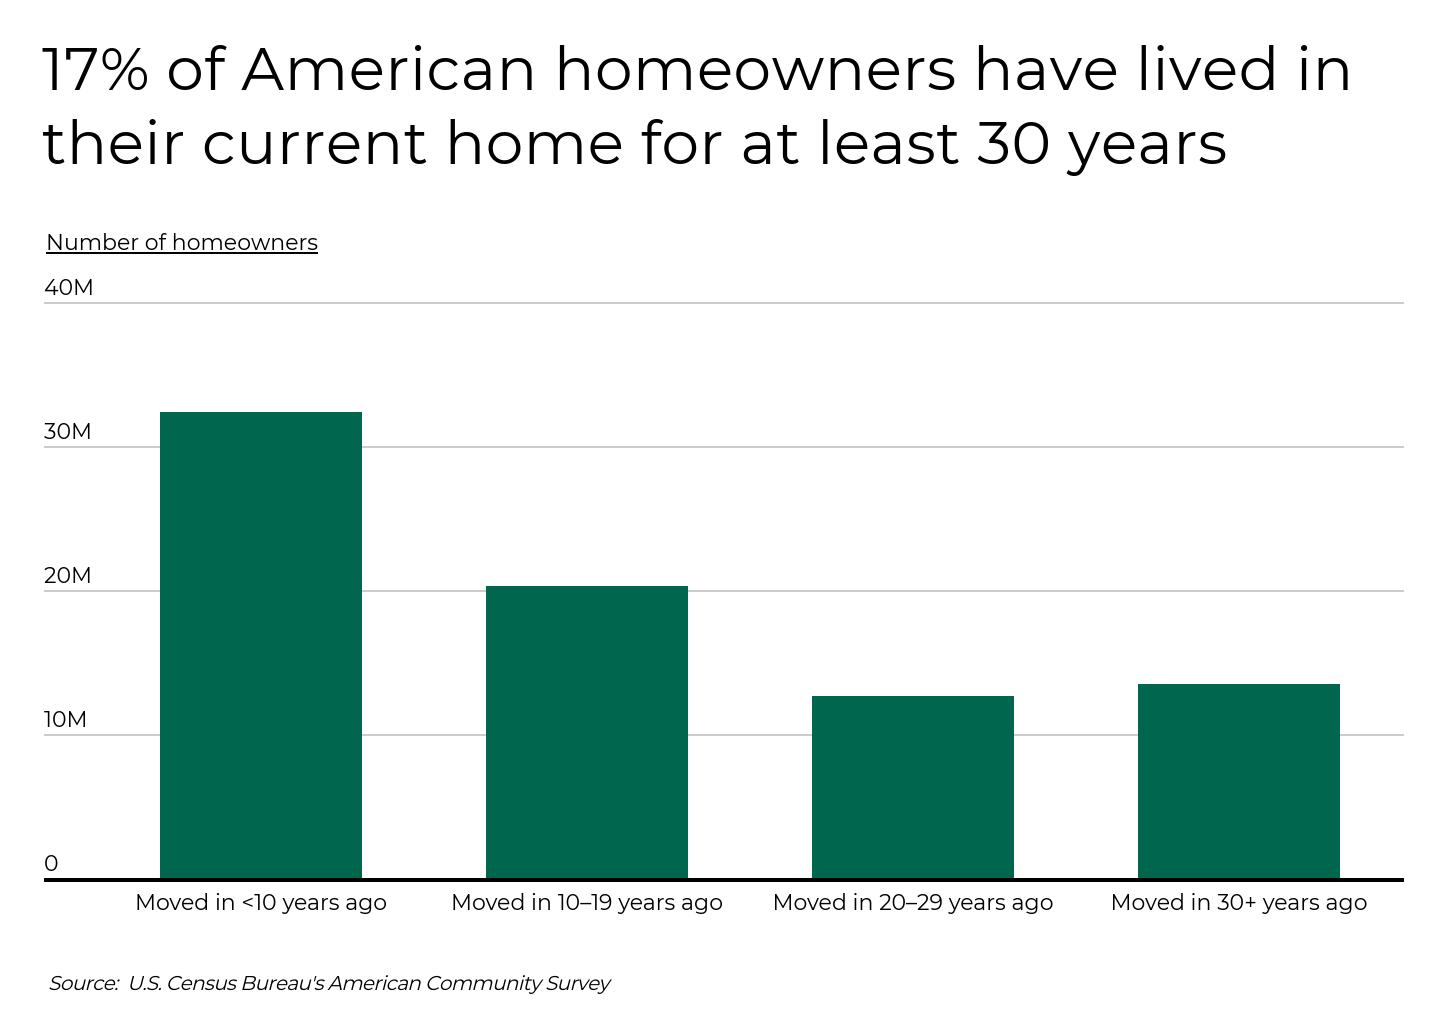
Beyond the unusual pandemic-era real estate conditions, however, one of the key factors that has led to the current market is a generational shift in home-buying. Baby Boomers were until recently the largest generation of Americans, and most Boomers hit prime home-buying age beginning in the late 1970s and continued to be the largest part of the market for several decades after that. Because many Boomers have elected to age in place rather than downsize, 13.5 million homeowners, or 17% of the total, have been in their current home for at least 30 years. This is creating challenges for the Millennial generation—now the largest by population—many of whom are looking to purchase their first or second home.
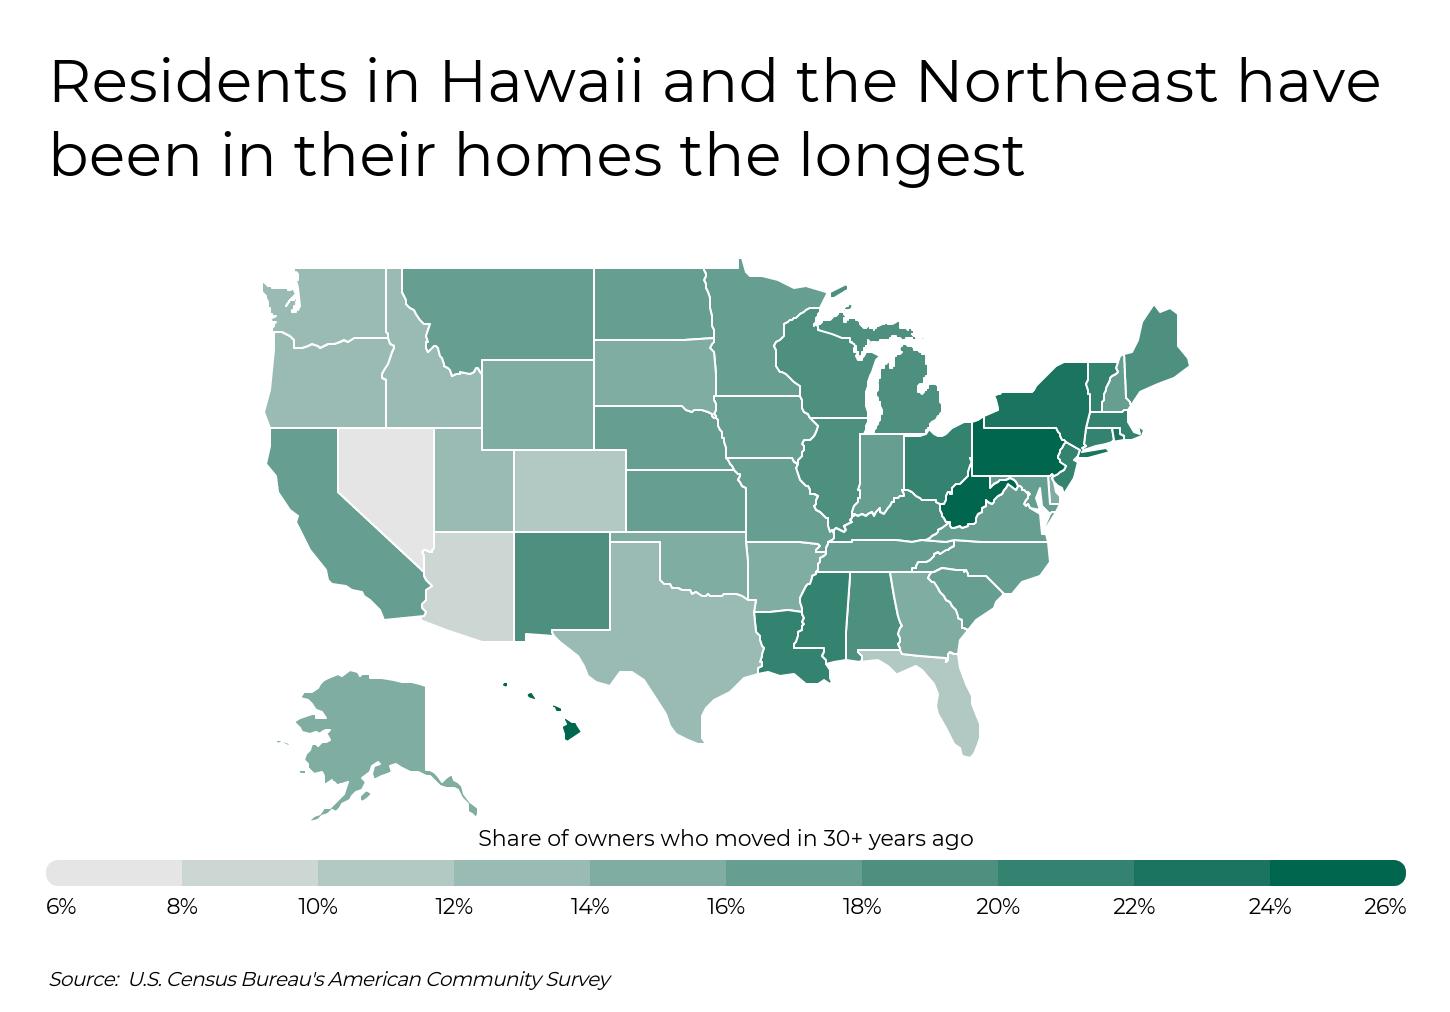
Some regions are seeing this phenomenon more than others. Hawaii leads the nation in long-term homeownership at 26.4% of homeowners having lived in their homes for 30 years or more. Many of the other top states are found in the Northeast in places like Pennsylvania (24.4%), New York (23.9%), and Rhode Island (23.3%). These states tend to have older, more stationary populations, along with higher housing costs or difficulties in developing new stock. These factors encourage homeowners to hold onto properties they have paid off entirely or where their housing costs are locked in at a lower level than they would face in the current market. At the other end of the spectrum, growing states like Nevada (5.9%), Arizona (8.9%), and Florida (10.5%) have the lowest share of long-term owners, with new residents moving in and taking advantage of a rapidly growing stock of housing.
Many of the same forces are at play in the list of metros where residents have been in their homes the longest, as the list is dominated by locations where housing costs are high, the population is older, or both. To identify these locations, researchers at Filterbuy used data from the U.S. Census Bureau’s American Community Survey to calculate the share of owners who moved in 30 years ago or more. In the event of a tie, the location with the higher share of owners who moved in 20–29 years ago was ranked higher.
Here are the metros whose residents have been in their homes the longest.
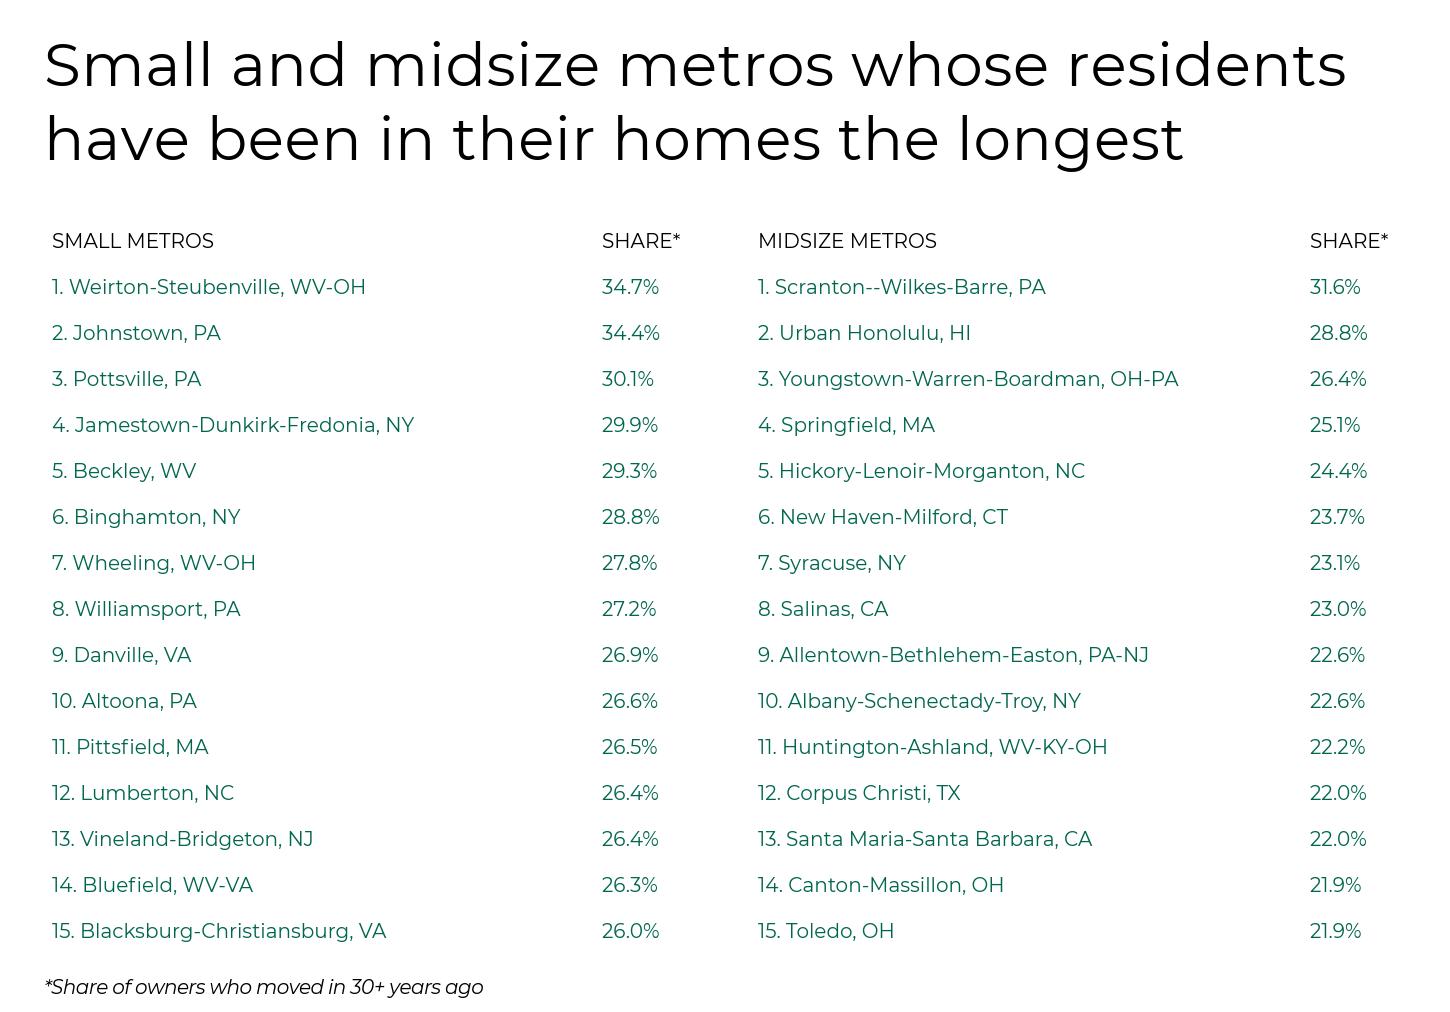
Photo Credit: Uladzik Kryhin / Shutterstock
Share of owners who moved in 30+ years ago: 19.4%
Share of owners who moved in 20–29 years ago: 18.2%
Share of owners who moved in 10–19 years ago: 26.2%
Share of owners who moved in <10 years ago: 36.1%
Total owner-occupied households: 365,949
Population: 1,990,660
RELATED Keep your home feeling fresh by replacing your home air filters regularly. Consider purchasing MERV 13 air filters for the highest level of protection.

Photo Credit: Concrete Jungle Media / Shutterstock
Share of owners who moved in 30+ years ago: 19.5%
Share of owners who moved in 20–29 years ago: 16.8%
Share of owners who moved in 10–19 years ago: 22.4%
Share of owners who moved in <10 years ago: 41.4%
Total owner-occupied households: 1,197,860
Population: 4,319,629

Photo Credit: f11photo / Shutterstock
Share of owners who moved in 30+ years ago: 19.7%
Share of owners who moved in 20–29 years ago: 17.3%
Share of owners who moved in 10–19 years ago: 25.6%
Share of owners who moved in <10 years ago: 37.4%
Total owner-occupied households: 380,470
Population: 1,575,179

Photo Credit: CO Leong / Shutterstock
Share of owners who moved in 30+ years ago: 20.0%
Share of owners who moved in 20–29 years ago: 16.6%
Share of owners who moved in 10–19 years ago: 23.7%
Share of owners who moved in <10 years ago: 39.7%
Total owner-occupied households: 1,142,121
Population: 4,873,019

Photo Credit: f11photo / Shutterstock
Share of owners who moved in 30+ years ago: 20.9%
Share of owners who moved in 20–29 years ago: 16.3%
Share of owners who moved in 10–19 years ago: 23.9%
Share of owners who moved in <10 years ago: 38.8%
Total owner-occupied households: 930,250
Population: 4,731,803

Photo Credit: Sean Pavone / Shutterstock
Share of owners who moved in 30+ years ago: 21.6%
Share of owners who moved in 20–29 years ago: 19.0%
Share of owners who moved in 10–19 years ago: 25.1%
Share of owners who moved in <10 years ago: 34.2%
Total owner-occupied households: 2,108,041
Population: 13,214,799

Photo Credit: f11photo / Shutterstock
Share of owners who moved in 30+ years ago: 21.7%
Share of owners who moved in 20–29 years ago: 16.9%
Share of owners who moved in 10–19 years ago: 26.9%
Share of owners who moved in <10 years ago: 34.5%
Total owner-occupied households: 307,875
Population: 1,270,530

Photo Credit: Sean Pavone / Shutterstock
Share of owners who moved in 30+ years ago: 21.8%
Share of owners who moved in 20–29 years ago: 17.3%
Share of owners who moved in 10–19 years ago: 26.6%
Share of owners who moved in <10 years ago: 34.3%
Total owner-occupied households: 1,549,373
Population: 6,102,434
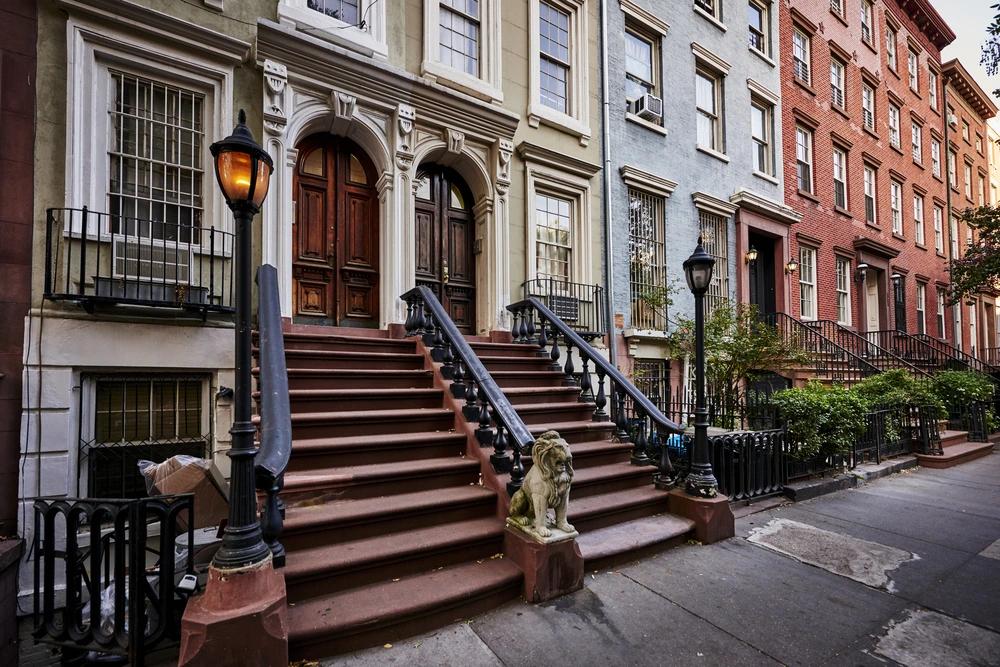
Photo Credit: Brian Goodman / Shutterstock
Share of owners who moved in 30+ years ago: 21.9%
Share of owners who moved in 20–29 years ago: 18.2%
Share of owners who moved in 10–19 years ago: 25.9%
Share of owners who moved in <10 years ago: 33.9%
Total owner-occupied households: 3,611,484
Population: 19,216,182

Photo Credit: Jon Bilous / Shutterstock
Share of owners who moved in 30+ years ago: 22.0%
Share of owners who moved in 20–29 years ago: 16.4%
Share of owners who moved in 10–19 years ago: 26.8%
Share of owners who moved in <10 years ago: 34.8%
Total owner-occupied households: 314,165
Population: 1,204,877
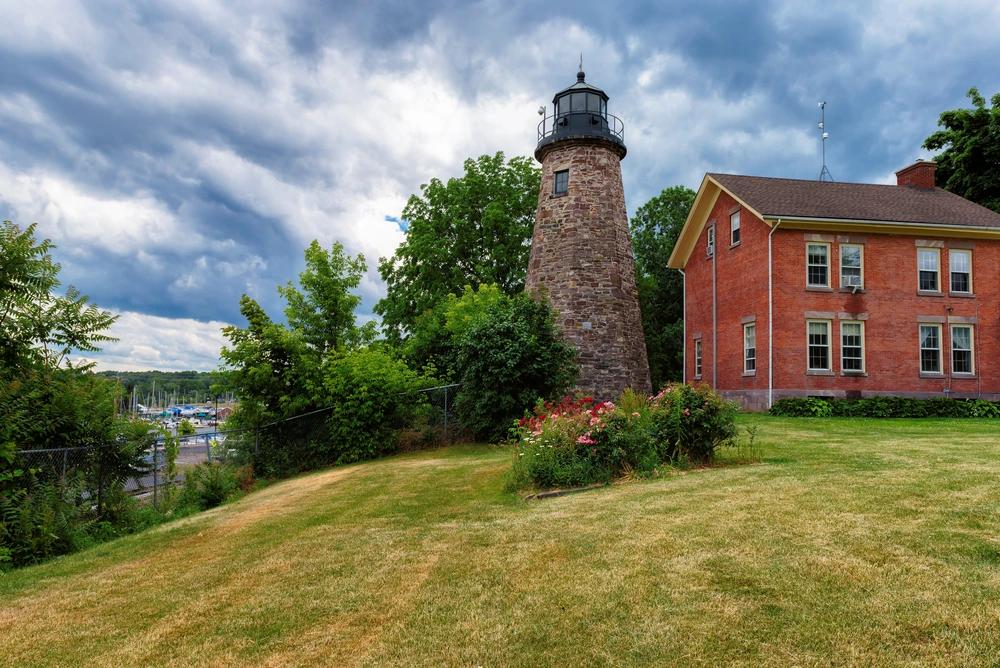
Photo Credit: Lucky-photographer / Shutterstock
Share of owners who moved in 30+ years ago: 22.1%
Share of owners who moved in 20–29 years ago: 17.7%
Share of owners who moved in 10–19 years ago: 25.2%
Share of owners who moved in <10 years ago: 35.1%
Total owner-occupied households: 289,876
Population: 1,069,644

Photo Credit: Henryk Sadura / Shutterstock
Share of owners who moved in 30+ years ago: 22.9%
Share of owners who moved in 20–29 years ago: 18.1%
Share of owners who moved in 10–19 years ago: 24.6%
Share of owners who moved in <10 years ago: 34.3%
Total owner-occupied households: 560,150
Population: 2,048,449

Photo Credit: Richard Cavalleri / Shutterstock
Share of owners who moved in 30+ years ago: 23.8%
Share of owners who moved in 20–29 years ago: 17.7%
Share of owners who moved in 10–19 years ago: 24.4%
Share of owners who moved in <10 years ago: 34.1%
Total owner-occupied households: 389,481
Population: 1,624,578

Photo Credit: Sergey Novikov / Shutterstock
Share of owners who moved in 30+ years ago: 25.6%
Share of owners who moved in 20–29 years ago: 16.7%
Share of owners who moved in 10–19 years ago: 24.2%
Share of owners who moved in <10 years ago: 33.5%
Total owner-occupied households: 321,024
Population: 1,127,983

Photo Credit: Jason Sponseller / Shutterstock
Share of owners who moved in 30+ years ago: 27.8%
Share of owners who moved in 20–29 years ago: 16.7%
Share of owners who moved in 10–19 years ago: 22.6%
Share of owners who moved in <10 years ago: 32.9%
Total owner-occupied households: 701,328
Population: 2,317,600
The data used in this analysis is from the U.S. Census Bureau’s American Community Survey 2019. To determine the locations whose residents have been in their homes the longest, researchers calculated the share of owners who moved in 30 years ago or more. In the event of a tie, the location with the higher share of owners who moved in 20–29 years ago was ranked higher. To improve relevance, only metropolitan areas with at least 100,000 residents were included. Additionally, metros were grouped into cohorts based on population size: small (100,000–349,999), midsize (350,000–999,999), and large (1,000,000 or more).