Shop by

By David Heacock
The U.S. labor market has been a strong one for workers for much of the two years since the COVID-19 pandemic began. After the pandemic shut down large parts of the economy and put millions out of work, employment has recovered quickly, and the unemployment rate sat at 3.6% as of June 2022. But workers have also been able to be more selective about their job opportunities. Workers across the income scale have sent quit rates to historic highs in what’s been coined the “Great Resignation,” seeking out jobs with better pay, working conditions, or alignment with their lifestyles or professional goals.
Despite the pandemic’s economic disruptions and the looming prospect of a recession, many workers today have excellent opportunities to earn more or advance their careers. And some fields offer even greater opportunity than others thanks to economic, demographic, and technological trends that predate the pandemic. From globalization to the aging of the population to the rise of the internet, major forces have reshaped the economy and created new professions and even new industries in a matter of years.
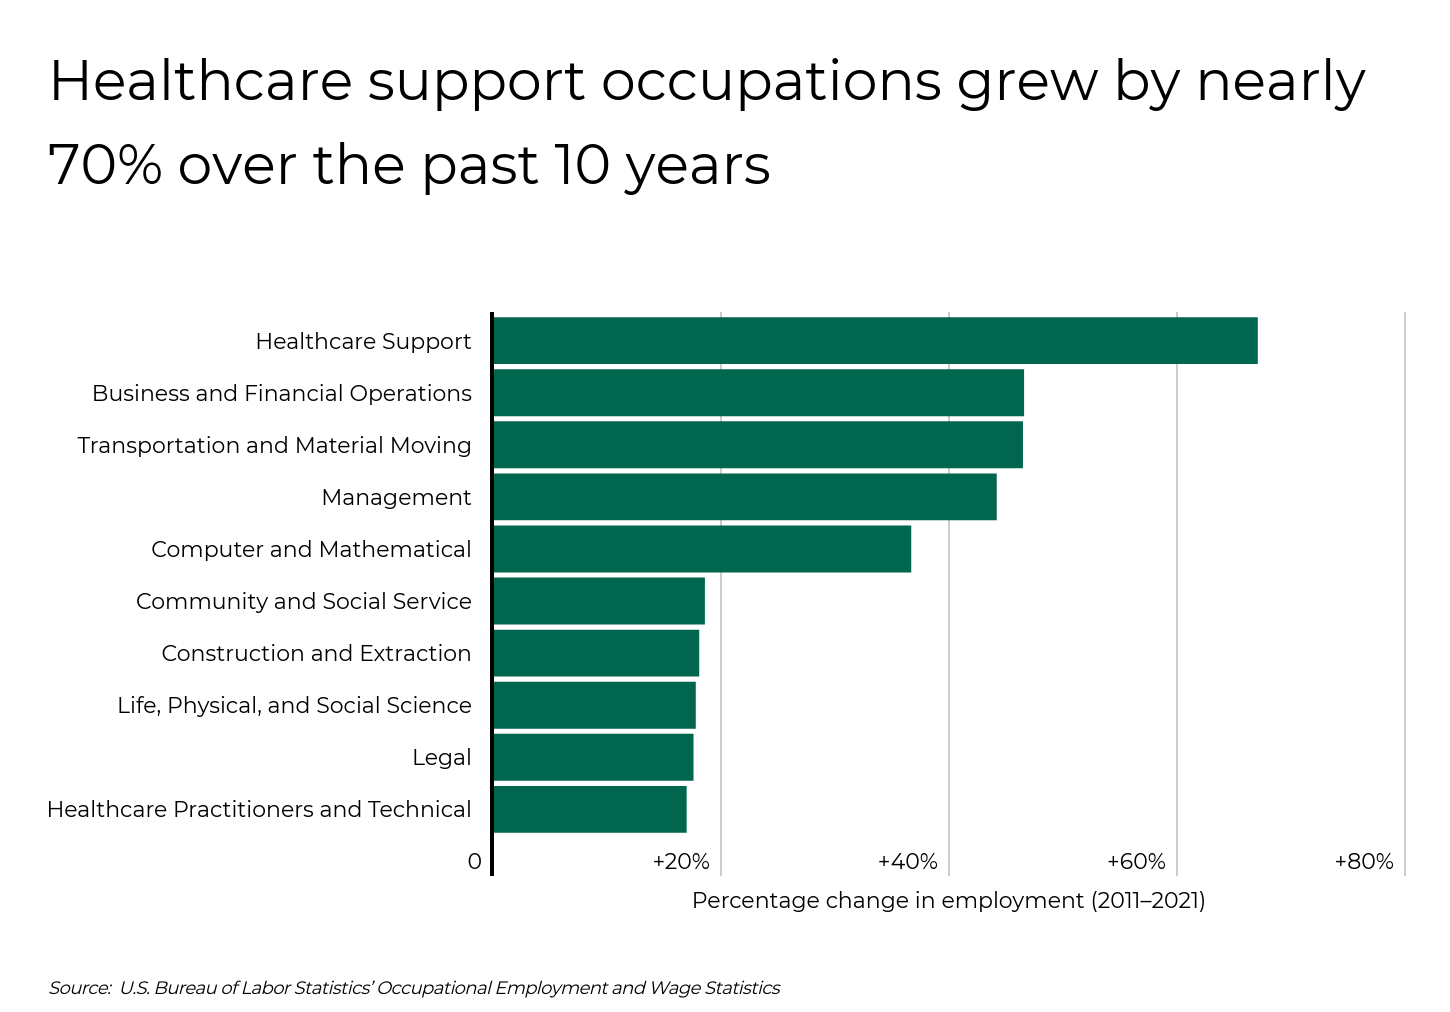
Among major occupational categories, healthcare support professions have seen the most significant growth over the last decade. These professions have seen a 67% increase in employment since 2011, powered in no small part by the aging and increased healthcare needs of the Baby Boomer generation. Other standout high-growth categories include business and financial operations, transportation and material moving, and management, each of which have had growth greater than 40% over the last decade during the economy’s steady recovery from the Great Recession. And computer and mathematical occupations have experienced an impressive 36.6% growth as technology, data, and analytics become ever more essential to how businesses function.
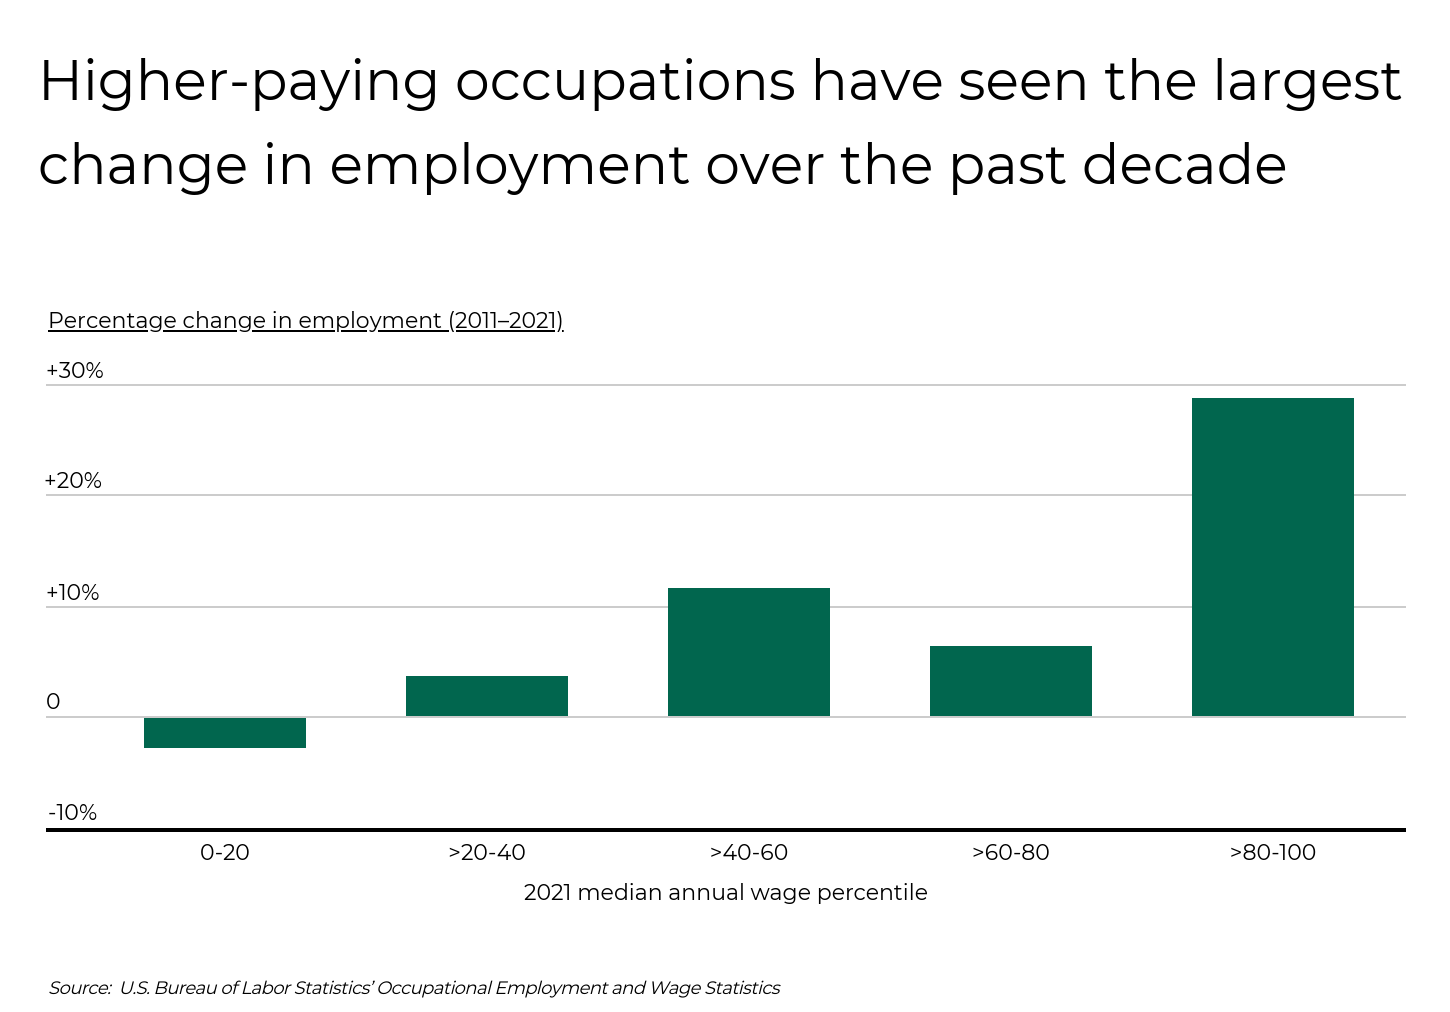
The economy’s fastest-growing occupational categories share another important characteristic: many of them pay well. Over the last decade, occupations in the lowest quintile for median annual wages experienced -2.6% growth, while occupations in the middle quintile saw employment growth of 11.6%. But the highest-earning occupations saw a 28.8% percentage change in employment between 2011 and 2021. These statistics highlight both increased opportunity in well-compensated professions and a lack of employment opportunities in lower-paying jobs.
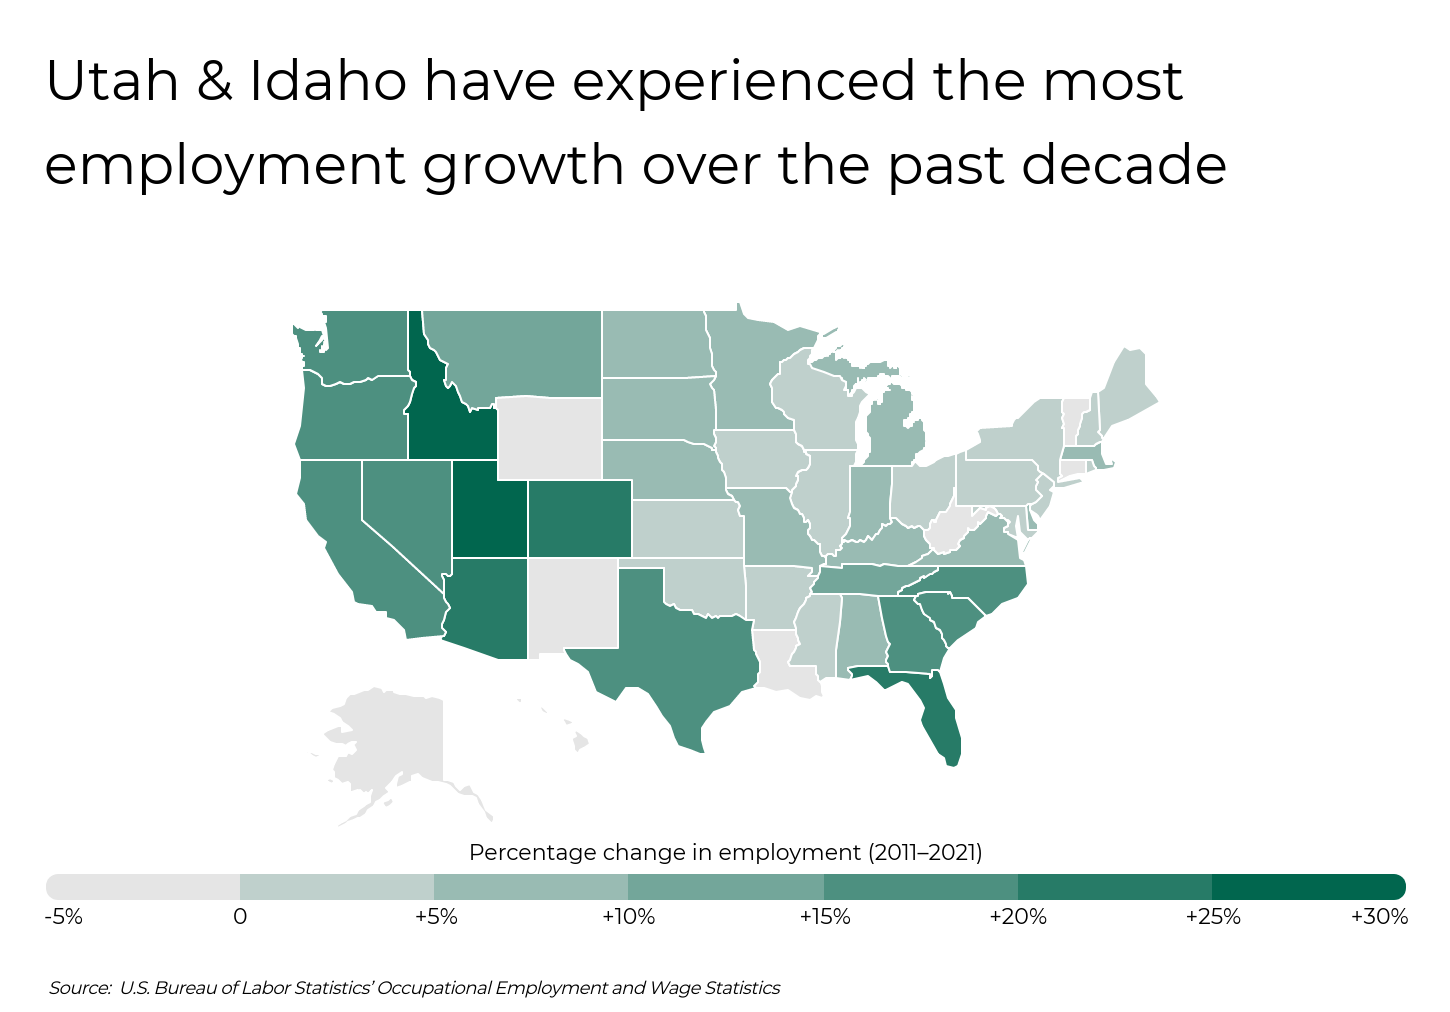
Employment growth has also been unevenly distributed by geography. The Mountain West has seen the greatest growth over the last decade. Utah leads the nation with 33.3% employment growth since 2011, followed by neighboring Idaho, Arizona, and Colorado, who each registered growth above 20%. Sun Belt states have also fared well, with Florida, Texas, California, and South Carolina among the fastest-growing states for employment. Conversely, eight states saw a decrease in the total number employed during this same time period.
LEARN MORE Filterbuy’s MERV 13 air filters trap 98% of airborne particles, including mold, bacteria, and those that carry viruses and will stop mold, fungus, or mildew from growing in your home. Consider replacing your home air filters today.
While employment growth overall has been strong in many fields, some specific occupations are clear standouts for the rate of growth they experienced between 2011 and 2021. Some professions more than doubled the total number of people employed, in jobs as diverse as airfield operations specialists, manicurists and pedicurists, and financial examiners. And in one case—mathematical science occupations—total employment more than tripled, with an impressive 215.1% growth over the last ten years.
The data used in this analysis is from the U.S. Bureau of Labor Statistics. To determine the jobs with the largest growth over the last decade, researchers at Filterbuy calculated the percentage change in employment between 2011 and 2021. In the event of a tie, the job with the greater total change in employment over the same time period was ranked higher. All measures of employment were considered at the national level, and only careers with full employment data were considered in this analysis.
Here are the jobs with the largest growth over the last decade.

Photo Credit: Pixel B / Shutterstock
Percentage change in employment (2011–2021): +74.5%
Total change in employment (2011–2021): +57,590
Total employment (2021): 134,880
Median annual wage (2021): $37,630
Percentage change in median annual wage (2011–2021): +13.3%

Photo Credit: dotshock / Shutterstock
Percentage change in employment (2011–2021): +74.9%
Total change in employment (2011–2021): +6,910
Total employment (2021): 16,140
Median annual wage (2021): $77,500
Percentage change in median annual wage (2011–2021): +8.2%

Photo Credit: anyaivanova / Shutterstock
Percentage change in employment (2011–2021): +77.4%
Total change in employment (2011–2021): +3,570
Total employment (2021): 8,180
Median annual wage (2021): $78,830
Percentage change in median annual wage (2011–2021): +22.7%

Photo Credit: fizkes / Shutterstock
Percentage change in employment (2011–2021): +77.9%
Total change in employment (2011–2021): +21,880
Total employment (2021): 49,970
Median annual wage (2021): $90,560
Percentage change in median annual wage (2011–2021): +18.0%

Photo Credit: Kaspars Grinvalds / Shutterstock
Percentage change in employment (2011–2021): +81.0%
Total change in employment (2011–2021): +1,240
Total employment (2021): 2,770
Median annual wage (2021): $42,600
Percentage change in median annual wage (2011–2021): +26.5%

Photo Credit: ESB Professional / Shutterstock
Percentage change in employment (2011–2021): +89.4%
Total change in employment (2011–2021): +8,640
Total employment (2021): 18,300
Median annual wage (2021): $48,060
Percentage change in median annual wage (2011–2021): +35.9%

Photo Credit: wavebreakmedia / Shutterstock
Percentage change in employment (2011–2021): +99.5%
Total change in employment (2011–2021): +41,510
Total employment (2021): 83,240
Median annual wage (2021): $29,120
Percentage change in median annual wage (2011–2021): +47.4%

Photo Credit: fizkes / Shutterstock
Percentage change in employment (2011–2021): +103.7%
Total change in employment (2011–2021): +84,780
Total employment (2021): 166,530
Median annual wage (2021): $126,230
Percentage change in median annual wage (2011–2021): +27.3%

Photo Credit: Olena Yakobchuk / Shutterstock
Percentage change in employment (2011–2021): +108.1%
Total change in employment (2011–2021): +6,550
Total employment (2021): 12,610
Median annual wage (2021): $47,880
Percentage change in median annual wage (2011–2021): +1.5%

Photo Credit: Anna Demianenko / Shutterstock
Percentage change in employment (2011–2021): +114.2%
Total change in employment (2011–2021): +64,270
Total employment (2021): 120,540
Median annual wage (2021): $29,210
Percentage change in median annual wage (2011–2021): +50.3%

Photo Credit: wutzkohphoto / Shutterstock
Percentage change in employment (2011–2021): +116.6%
Total change in employment (2011–2021): +32,700
Total employment (2021): 60,750
Median annual wage (2021): $81,410
Percentage change in median annual wage (2011–2021): +8.2%

Photo Credit: SeventyFour / Shutterstock
Percentage change in employment (2011–2021): +116.6%
Total change in employment (2011–2021): +57,150
Total employment (2021): 106,170
Median annual wage (2021): $48,090
Percentage change in median annual wage (2011–2021): +5.6%

Photo Credit: David Gyung / Shutterstock
Percentage change in employment (2011–2021): +128.6%
Total change in employment (2011–2021): +409,350
Total employment (2021): 727,540
Median annual wage (2021): $63,920
Percentage change in median annual wage (2011–2021): +6.1%

Photo Credit: fiphoto / Shutterstock
Percentage change in employment (2011–2021): +137.5%
Total change in employment (2011–2021): +92,500
Total employment (2021): 159,790
Median annual wage (2021): $32,060
Percentage change in median annual wage (2011–2021): +22.4%

Photo Credit: MIND AND I / Shutterstock
Percentage change in employment (2011–2021): +215.1%
Total change in employment (2011–2021): +2,710
Total employment (2021): 3,970
Median annual wage (2021): $62,460
Percentage change in median annual wage (2011–2021): +11.4%
The data used in this analysis is from the U.S. Bureau of Labor Statistics’ Occupational Employment and Wage Statistics data. To determine the jobs with the largest growth over the last decade, researchers at Filterbuy calculated the percentage change in employment between 2011 and 2021. In the event of a tie, the job with the greater total change in employment over the same time period was ranked higher. All measures of employment were considered at the national level, and only careers with full employment data were considered in this analysis.
