May 5, 2026

By David Heacock
The latest surge in COVID-19 cases caused by the Omicron variant once again disrupted an economic recovery that has been uneven to date. While most jurisdictions did not resort to the same sorts of public health restrictions instituted in early 2020, many businesses struggled to operate at full capacity with employees sick due to COVID and many consumers behaving more cautiously. Industries that have been hard-hit throughout the pandemic, like restaurants and airlines, experienced new disruptions heading into 2022.
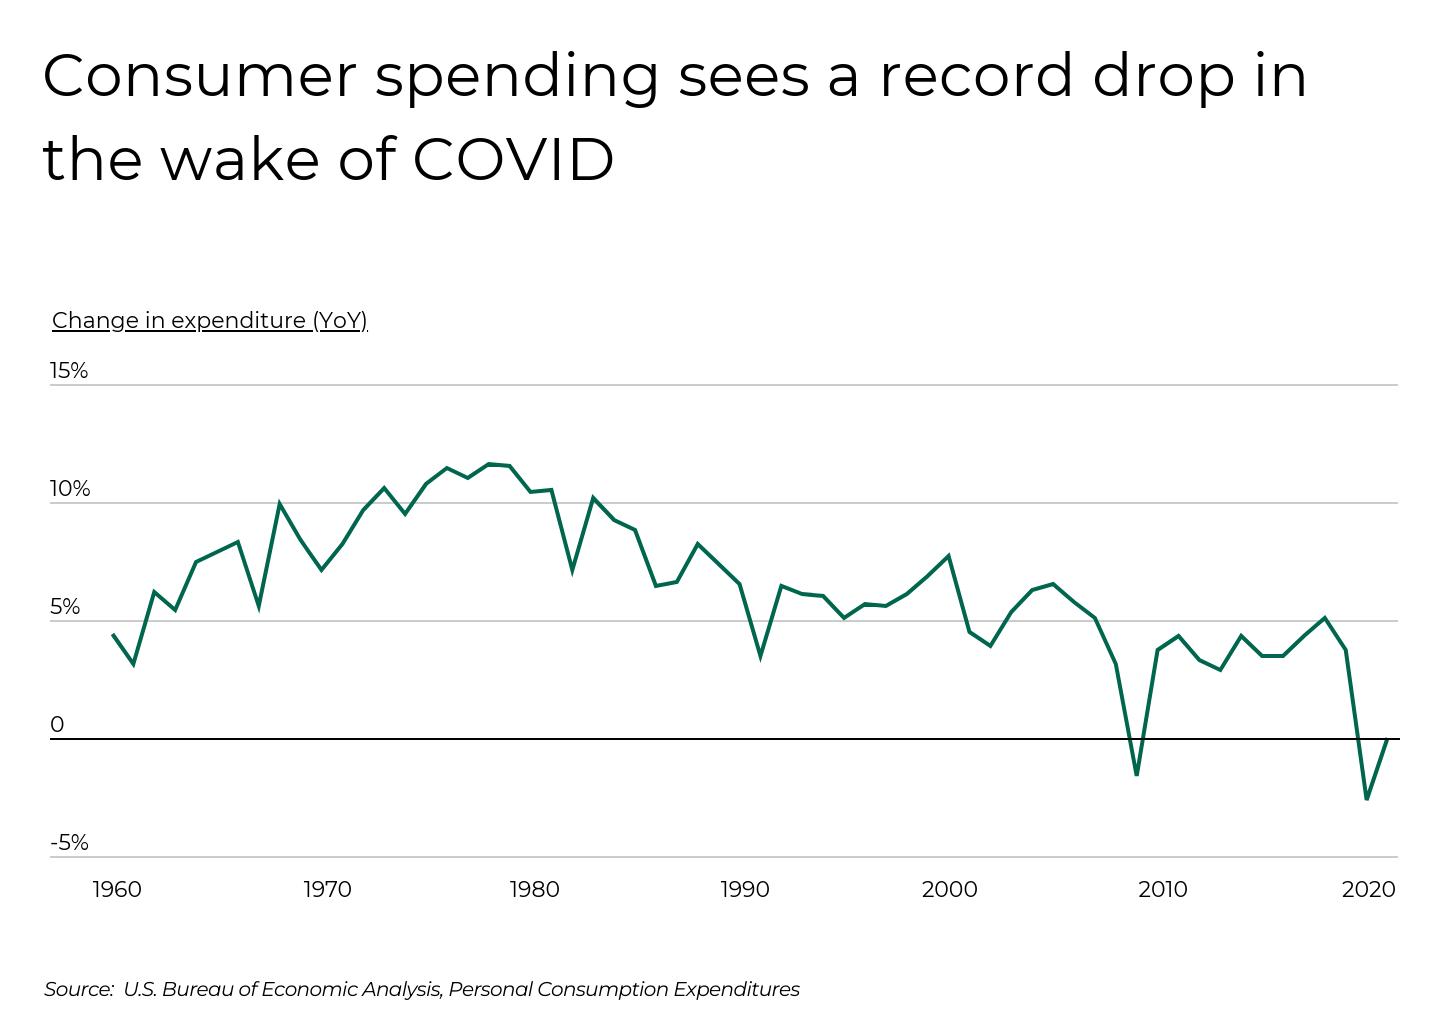
Economic challenges associated with Omicron and future variants could once again depress consumer spending, piling on top of an unusual decrease in consumer expenditures during the pandemic’s first year. For most of the last 60 years, consumer spending has increased year over year, even during economic downturns. But from 2019 to 2020, overall consumer spending fell by 2.6%, the largest year-over-year decline since the Great Recession.
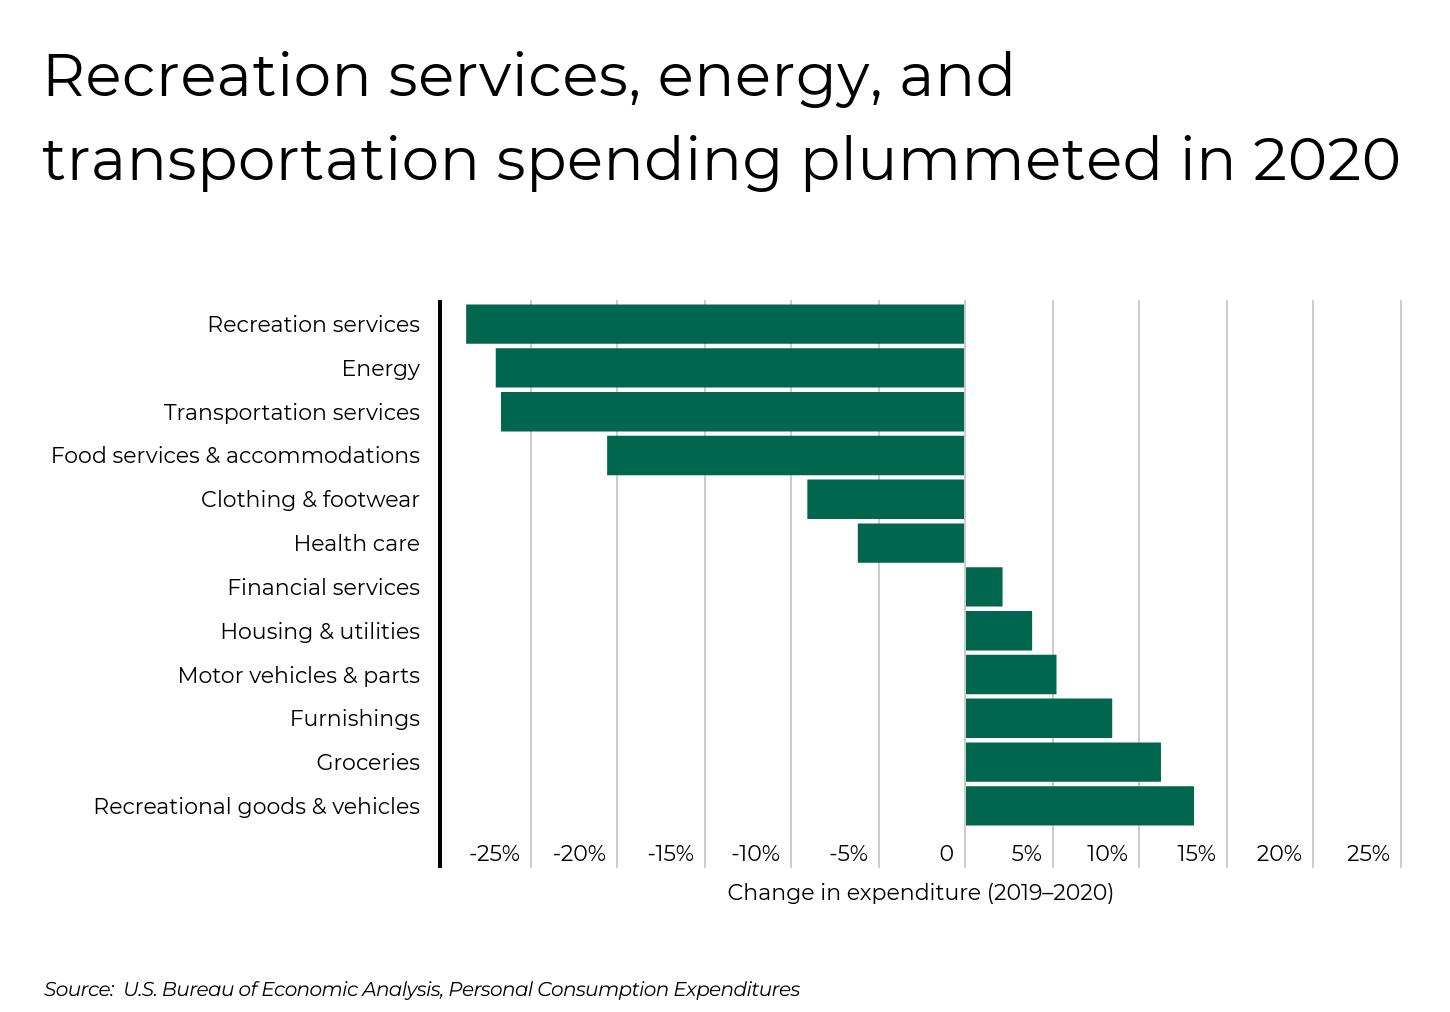
COVID’s effects on consumer spending have not been consistent across all categories, which means that some industries are struggling more than others. Public health restrictions affecting certain types of businesses and consumers’ shifting preferences from spending more time at home have driven trends in expenditures. In some cases, these factors have created divergent spending trends between similar categories. For example, spending on food services and accommodations dropped by 20.5% from 2019 to 2020, while spending on groceries was up 11.2% over the same period. Similarly, recreation services—which includes businesses like sports venues and theaters—saw the largest overall decline at 28.6%, but recreational goods and vehicles saw the largest overall increase at 13.1%.
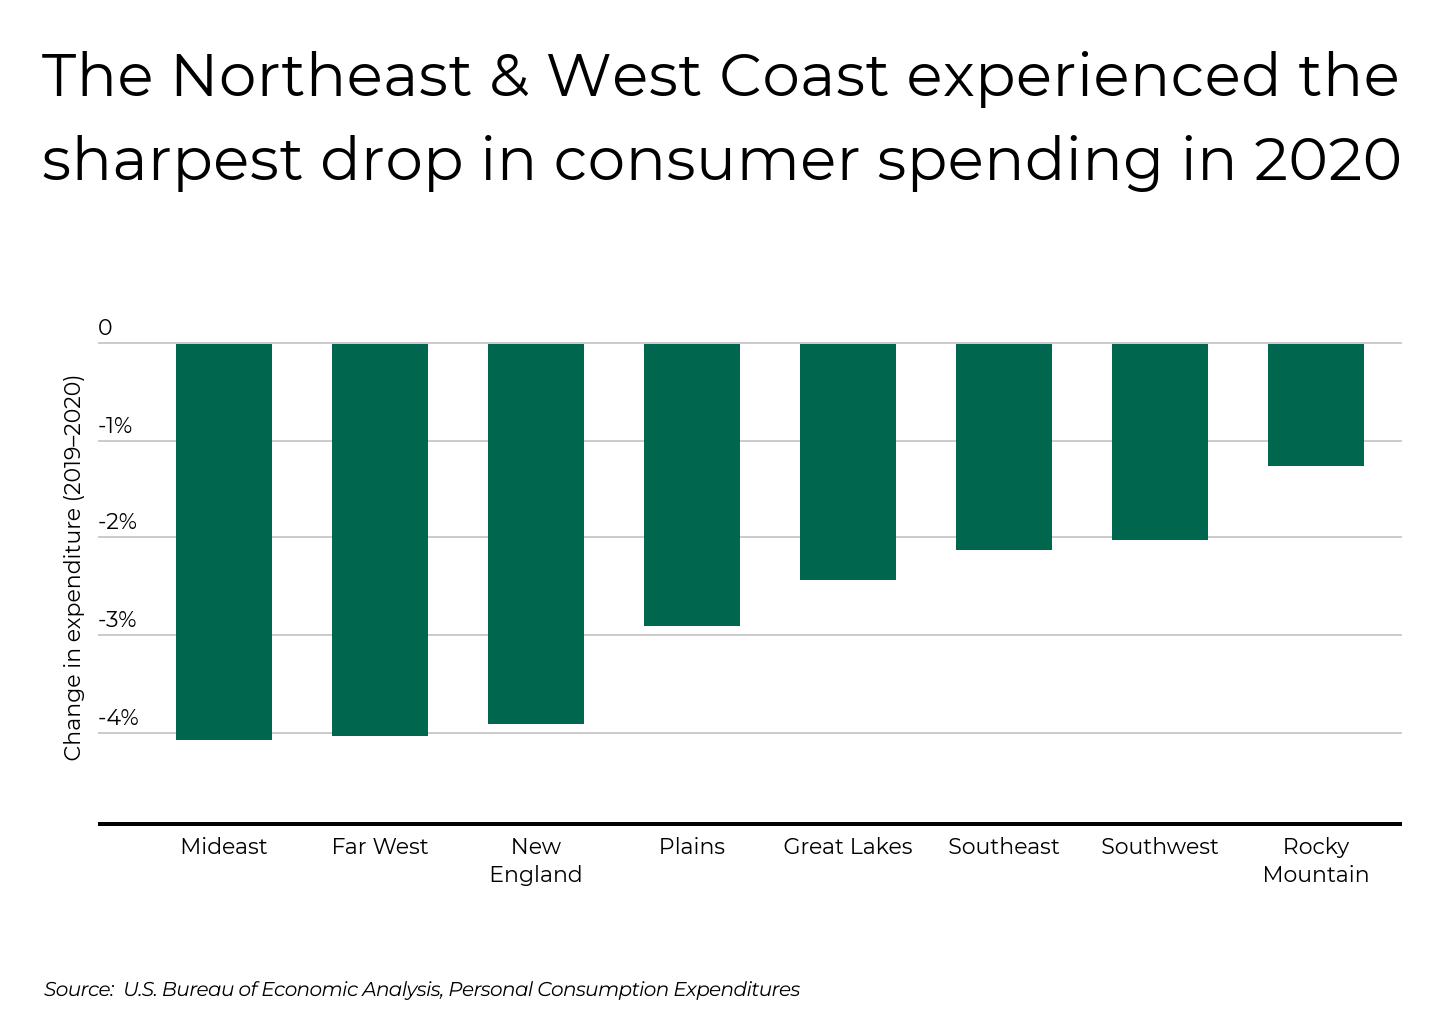
In addition to differences by spending category, declines in consumer spending also varied by geography. The region with the greatest drop in spending was the Mideast (including Delaware, New Jersey, New York, Pennsylvania, and Maryland), with a 4.07% decrease from 2019 to 2020, followed by the Far West at 4.03%. In contrast, the Rocky Mountain region had the lowest decrease, with consumers spending only 1.25% less in 2020 than in 2019.
RELATED The concentration of some air pollutants can be up to five times higher indoors than outdoors, which is why your home air filters are so important—especially if you have asthma or other respiratory health issues. Filterbuy’s MERV 13 air filters trap 98% of airborne particles.
Among states, most of the locations where consumer spending dropped the most were found in the Mideast, Far West, and New England regions. For most of these states, the declines are explained in large part by decreases in spending on recreation services, transportation services, or both. Recreation services were slow to return to full capacity in many locations because they were considered less essential and frequently likely to contribute to the spread of the coronavirus. Areas with high populations of commuters usually relying on vehicles or public transportation, like densely populated areas in the Northeast, saw declines in transportation spending with the greater transition to remote work.
The data used in this analysis is from the U.S. Bureau of Economic Analysis’s Personal Consumption Expenditures. To determine the states with the biggest drop in spending during COVID-19, researchers calculated the percentage change in per capita consumer spending from 2019 to 2020. In the event of a tie, the state with the lower total change in per capita consumer spending from 2019 to 2020 was ranked higher.
Here are the states with the biggest drop in spending during COVID.
Photo Credit: Sean Pavone / Shutterstock
Percentage change in consumer spending (2019-2020): -3.1%
Total change in consumer spending (2019-2020): -$1,376
Per capita consumer spending (2020): $43,615
Per capita consumer spending (2019): $44,991
Category with the largest decrease in spending: Transportation services
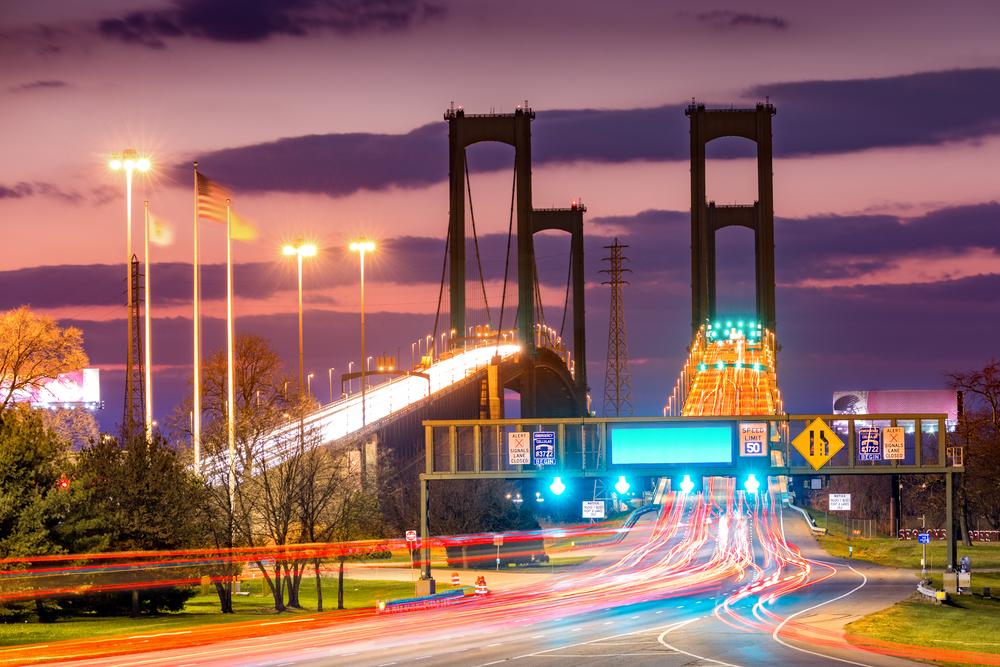
Photo Credit: Mihai_Andritoiu / Shutterstock
Percentage change in consumer spending (2019-2020): -3.2%
Total change in consumer spending (2019-2020): -$1,526
Per capita consumer spending (2020): $45,434
Per capita consumer spending (2019): $46,960
Category with the largest decrease in spending: Transportation services

Photo Credit: f11photo / Shutterstock
Percentage change in consumer spending (2019-2020): -3.5%
Total change in consumer spending (2019-2020): -$1,647
Per capita consumer spending (2020): $46,041
Per capita consumer spending (2019): $47,688
Category with the largest decrease in spending: Transportation services
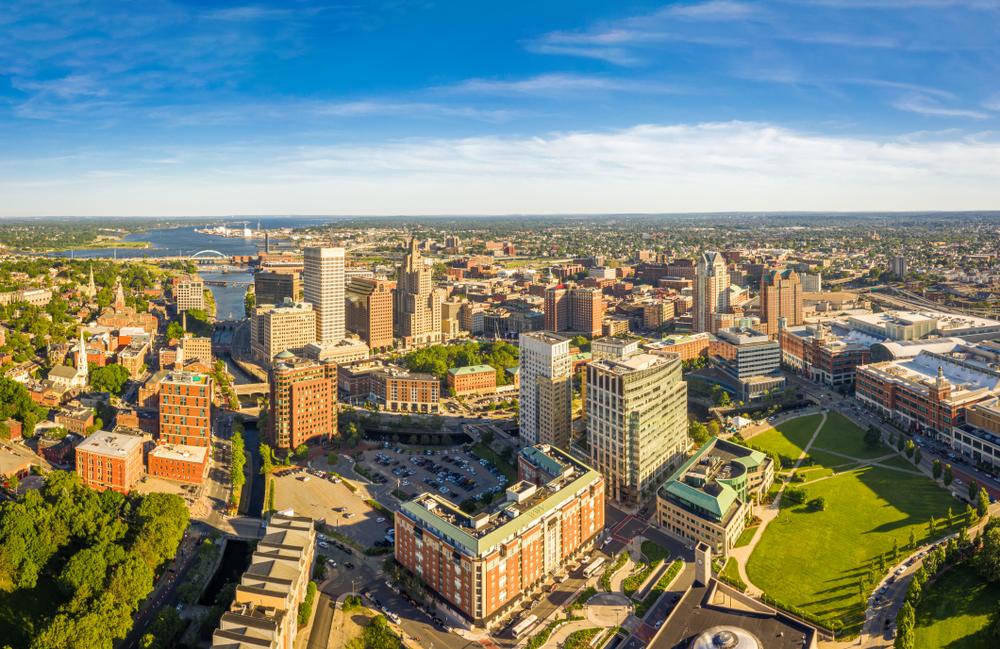
Photo Credit: Mihai_Andritoiu / Shutterstock
Percentage change in consumer spending (2019-2020): -3.7%
Total change in consumer spending (2019-2020): -$1,660
Per capita consumer spending (2020): $42,944
Per capita consumer spending (2019): $44,604
Category with the largest decrease in spending: Gasoline and other energy goods

Photo Credit: Jacob Boomsma / Shutterstock
Percentage change in consumer spending (2019-2020): -3.7%
Total change in consumer spending (2019-2020): -$1,668
Per capita consumer spending (2020): $43,945
Per capita consumer spending (2019): $45,613
Category with the largest decrease in spending: Gasoline and other energy goods

Photo Credit: Virrage Images / Shutterstock
Percentage change in consumer spending (2019-2020): -3.8%
Total change in consumer spending (2019-2020): -$1,532
Per capita consumer spending (2020): $39,211
Per capita consumer spending (2019): $40,743
Category with the largest decrease in spending: Gasoline and other energy goods

Photo Credit: Sean Pavone / Shutterstock
Percentage change in consumer spending (2019-2020): -3.8%
Total change in consumer spending (2019-2020): -$1,888
Per capita consumer spending (2020): $47,397
Per capita consumer spending (2019): $49,285
Category with the largest decrease in spending: Recreation services

Photo Credit: Sean Pavone / Shutterstock
Percentage change in consumer spending (2019-2020): -3.9%
Total change in consumer spending (2019-2020): -$1,828
Per capita consumer spending (2020): $44,650
Per capita consumer spending (2019): $46,478
Category with the largest decrease in spending: Recreation services

Photo Credit: Sean Pavone / Shutterstock
Percentage change in consumer spending (2019-2020): -4.3%
Total change in consumer spending (2019-2020): -$2,086
Per capita consumer spending (2020): $46,636
Per capita consumer spending (2019): $48,722
Category with the largest decrease in spending: Recreation services

Photo Credit: Sean Pavone / Shutterstock
Percentage change in consumer spending (2019-2020): -4.4%
Total change in consumer spending (2019-2020): -$2,051
Per capita consumer spending (2020): $44,331
Per capita consumer spending (2019): $46,382
Category with the largest decrease in spending: Recreation services

Photo Credit: photo.ua / Shutterstock
Percentage change in consumer spending (2019-2020): -4.6%
Total change in consumer spending (2019-2020): -$2,129
Per capita consumer spending (2020): $44,403
Per capita consumer spending (2019): $46,532
Category with the largest decrease in spending: Recreation services

Photo Credit: Sean Pavone / Shutterstock
Percentage change in consumer spending (2019-2020): -4.6%
Total change in consumer spending (2019-2020): -$2,416
Per capita consumer spending (2020): $49,735
Per capita consumer spending (2019): $52,151
Category with the largest decrease in spending: Transportation services

Photo Credit: Izabela23 / Shutterstock
Percentage change in consumer spending (2019-2020): -4.7%
Total change in consumer spending (2019-2020): -$2,233
Per capita consumer spending (2020): $45,080
Per capita consumer spending (2019): $47,313
Category with the largest decrease in spending: Transportation services

Photo Credit: Sean Pavone / Shutterstock
Percentage change in consumer spending (2019-2020): -5.0%
Total change in consumer spending (2019-2020): -$2,762
Per capita consumer spending (2020): $52,001
Per capita consumer spending (2019): $54,763
Category with the largest decrease in spending: Transportation services

Photo Credit: Marcus Biastock / Shutterstock
Percentage change in consumer spending (2019-2020): -5.4%
Total change in consumer spending (2019-2020): -$2,760
Per capita consumer spending (2020): $48,739
Per capita consumer spending (2019): $51,499
Category with the largest decrease in spending: Recreation services
The data used in this analysis is from the U.S. Bureau of Economic Analysis’s Personal Consumption Expenditures. To determine the states with the biggest drop in spending during COVID, researchers calculated the percentage change in consumer spending from 2019 to 2020. In the event of a tie, the state with the lower total change in consumer spending from 2019 to 2020 was ranked higher.