
U.S. States With The Most Extreme Weather
May 20, 2026

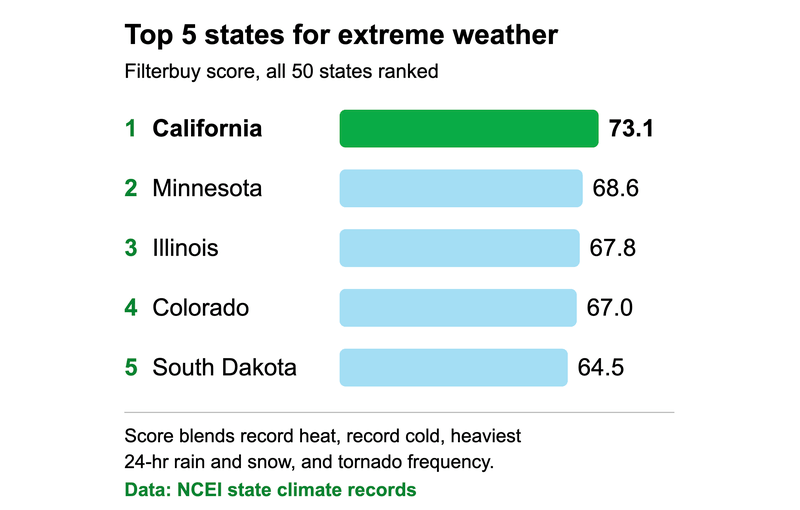
California has the most extreme weather in the U.S., followed by Minnesota, Illinois, Colorado, and South Dakota. Filterbuy scored all 50 states on record heat and cold, heaviest one-day rain and snow, and tornado frequency.
Those swings affect the air inside your home, too: wildfire smoke, dust, pollen, and stagnant winter air can push particles indoors. Take the quick quiz below to find your filter match.
Heat and cool with a mini split?
Answer a few quick questions and we'll match you to the right filter for your system.
Not using a mini split? Find filters for your central HVAC system in any size.
TL;DR
California has the most extreme weather in the U.S., according to Filterbuy's analysis of NOAA state climate records for all 50 states, with Minnesota, Illinois, Colorado, and South Dakota close behind. The costs are rising, too: the U.S. has logged 438 billion-dollar weather disasters since 1980, including 12 in the first half of 2026. As a U.S. air filter maker, Filterbuy sees the result firsthand: smoke, dust, pollen, and humidity follow the weather indoors.
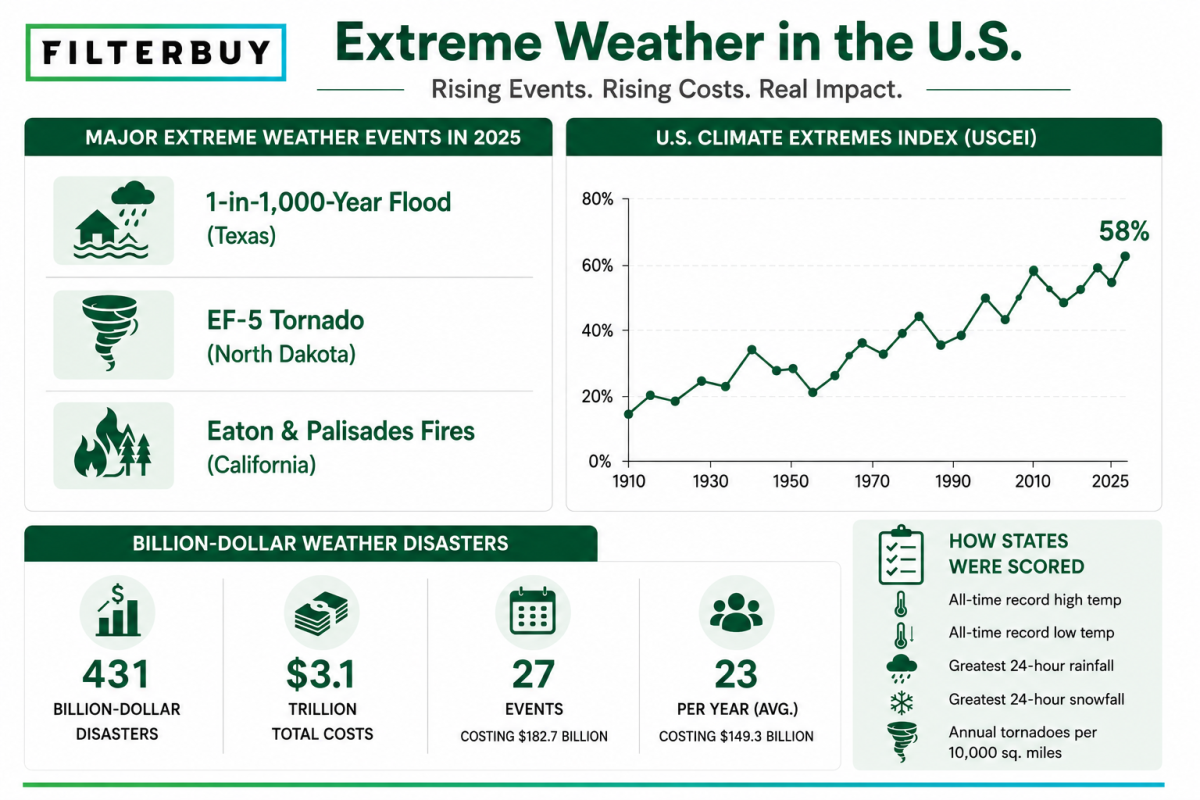
From record-shattering heat to polar-vortex cold, the United States keeps pushing the limits of what "normal" weather means. In 2025, a 1-in-1,000-year flood killed at least 135 people in the Texas Hill Country after nearly two feet of rain fell in days. North Dakota recorded the country's first verified EF-5 tornado since 2013. And Southern California's Eaton and Palisades Fires became the second- and third-most destructive wildfires in state history, destroying more than 16,000 structures in a single month.
These aren't isolated events. They fit a decades-long pattern of rising extremes. According to the CDC, a changing climate brings more variable weather, longer heat waves, heavier rainfall, deeper droughts, stronger storms, and worsening air pollution. The U.S. Climate Extremes Index (USCEI) tracked temperature, precipitation, drought, and tropical storm intensity at 58% above average in 2025, the 12th-highest reading in a 116-year record.
The financial toll keeps climbing, too. As of 2026, the U.S. has sustained 431 billion-dollar weather disasters, with total costs topping $3.1 trillion. In 2024 alone, the country logged 27 such events costing $182.7 billion. From 2020 to 2024, the U.S. averaged 23 billion-dollar disasters a year at $149.3 billion annually, more than double the long-term pace.
Extreme weather doesn't hit every state the same way. To find out which states face the wildest conditions, researchers at Filterbuy built a composite score for all 50 states using data from the National Centers for Environmental Information. The score weighs each state's all-time record high and low temperatures, greatest 24-hour rainfall, greatest 24-hour snowfall, and annual tornadoes per 10,000 square miles.
Here's what we found.
Key Takeaways
Extreme weather is now the norm, not the exception. The U.S. has logged 431 billion-dollar disasters since 1980, with combined damages above $3.1 trillion.
Costs are accelerating fast. From 2020 to 2024, the U.S. averaged 23 billion-dollar events per year at $149.3 billion, far above the long-term pace of about 9 events a year.
2025 broke records across the board, including a 1,000-year flood in Texas, the first EF-5 tornado since 2013, and two of California's most destructive wildfires ever.
Climate extremes are trending up. The 2025 USCEI sat 58% above average, ranking 12th-highest in 116 years of data.
California ranks #1 for extreme weather, driven by record heat, mountain snowfall, coastal fog, and some of the worst wildfire smoke in the nation.
Weather variability hits your indoor air. Wildfire smoke, agricultural dust, pollen surges, and winter air stagnation all push particles into your home.
A quality air filter is your first line of defense. For most homes in high-variability states, a MERV 11 filter changed every 60 to 90 days is a smart baseline.
Top 15 States With the Most Extreme Weather
15. Maryland
Region: Mid-Atlantic Extreme weather score: 55.5 Max temperature: 109°F Min temperature: −40°F Greatest 24-hr precipitation: 14.8 in Max 24-hr snowfall: 31.0 in Tornadoes per 10k sq mi: 9.9
Maryland's climate swings wide: humid summers with tropical storm remnants, then sharp winter cold snaps. Year-round filtration matters here. A MERV 11 filter changed every 60 to 90 days is a smart baseline for most Maryland homes.
Shop Air Filters near Maryland
14. Iowa
Region: Midwest Extreme weather score: 56.3 Max temperature: 118°F Min temperature: −47°F Greatest 24-hr precipitation: 13.2 in Max 24-hr snowfall: 24.0 in Tornadoes per 10k sq mi: 9.1
Iowa sits in Tornado Alley with some of the country's most dramatic temperature swings: blistering summers, brutal polar-vortex winters, and frequent storms that kick up farm dust and pollen year-round. A MERV 11 filter changed every 60 to 90 days is a strong baseline for most Iowa homes.

13. Texas
Region: South Extreme weather score: 56.7 Max temperature: 120°F Min temperature: −23°F Greatest 24-hr precipitation: 42.0 in Max 24-hr snowfall: 26.0 in Tornadoes per 10k sq mi: 5.9
Texas spans wildly different climates, from humid Gulf Coast storms and oppressive summer heat to arid West Texas and rare winter ice events. Its size means air quality challenges shift by region, ranging from tropical moisture to desert dust and wildfire smoke. A MERV 11 filter changed every 60 to 90 days works well for most Texas homes.
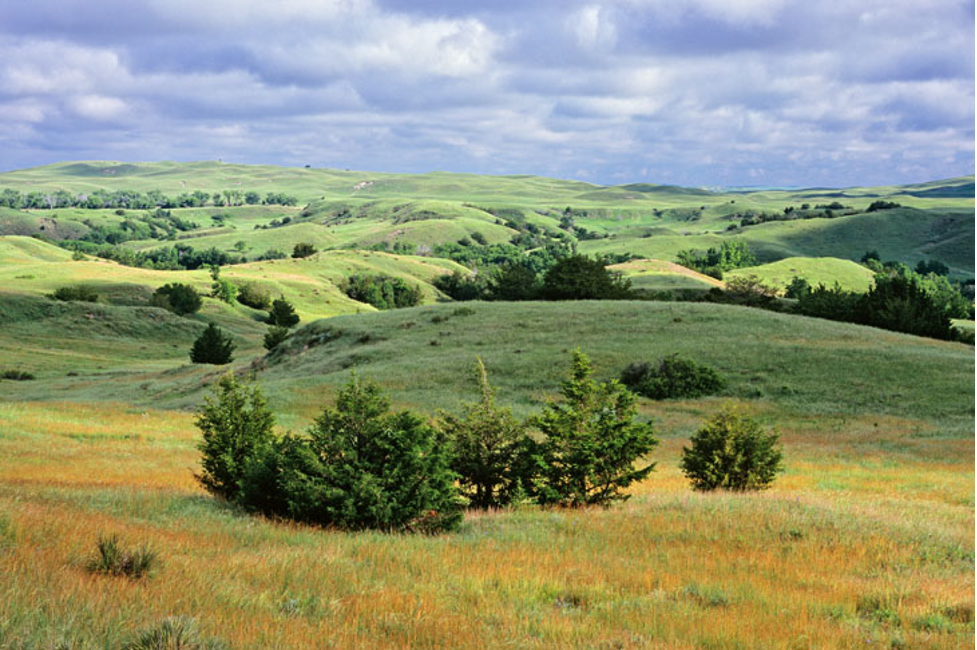
12. Nebraska
Region: Great Plains Extreme weather score: 56.7 Max temperature: 118°F Min temperature: −47°F Greatest 24-hr precipitation: 13.2 in Max 24-hr snowfall: 27.0 in Tornadoes per 10k sq mi: 7.4
Nebraska sits in Tornado Alley with extreme temperature swings: scorching summers and polar-vortex winters that can dip past −40°F. Farm dust, spring pollen, and hail are common air quality challenges across the Great Plains. A MERV 11 filter changed every 60 to 90 days is a solid baseline for most Nebraska homes.
Shop Air Filters near Nebraska
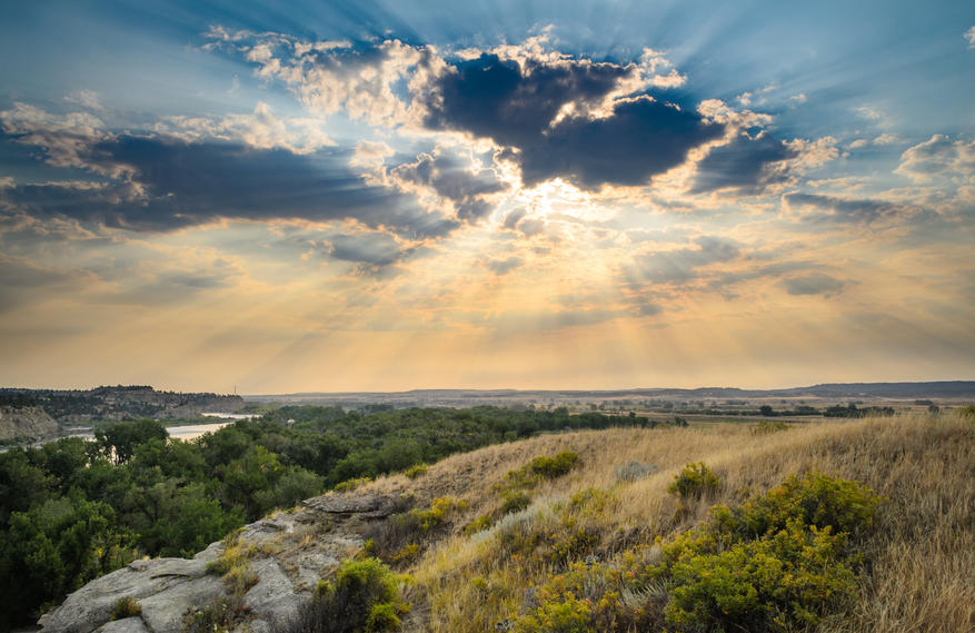
11. Montana
Region: Northern Rockies Extreme weather score: 58.0 Max temperature: 117°F Min temperature: −70°F Greatest 24-hr precipitation: 11.5 in Max 24-hr snowfall: 48.0 in Tornadoes per 10k sq mi: 0.7
Montana faces brutal continental winters with record cold and heavy snow, plus dry summers when wildfire smoke drifts statewide. Even with few tornadoes, winter air stagnation and seasonal dust mean indoor air quality shifts dramatically through the year. A MERV 11 filter changed every 60 to 90 days is a smart baseline for most Montana homes.
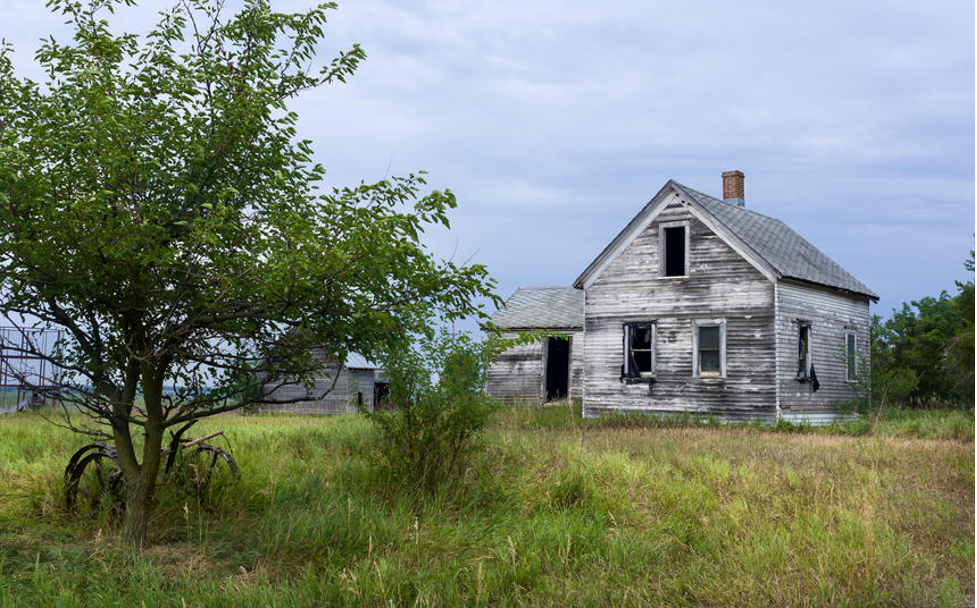
10. Missouri
Region: Midwest Extreme weather score: 58.8 Max temperature: 118°F Min temperature: −40°F Greatest 24-hr precipitation: 18.2 in Max 24-hr snowfall: 24.0 in Tornadoes per 10k sq mi: 6.5
Missouri sits at the crossroads of major weather systems: humid subtropical summers, harsh polar-vortex winters, and frequent spring thunderstorms that stir up moisture and dust. River valley areas trap stagnant air in winter, and spring and fall both bring rapid pollen surges. A MERV 11 filter changed every 60 to 90 days is a strong baseline for most Missouri homes.
Shop Air Filters near Missouri
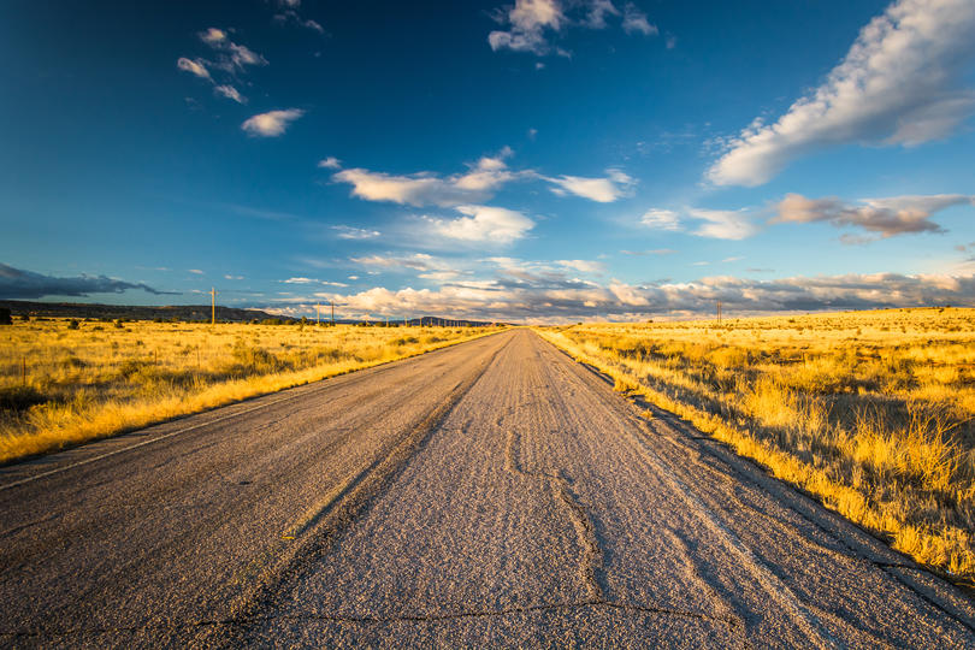
9. New Mexico
Region: Southwest Extreme weather score: 58.8 Max temperature: 122°F Min temperature: −50°F Greatest 24-hr precipitation: 11.3 in Max 24-hr snowfall: 41.0 in Tornadoes per 10k sq mi: 0.9
New Mexico's high desert climate delivers scorching summers, snowy mountain winters, and dust storms that can quickly slash visibility and air quality. Regional wildfire smoke also drifts in seasonally. A MERV 11 filter changed every 60 to 90 days is a solid baseline for most New Mexico homes.
Shop Air Filters near New Mexico
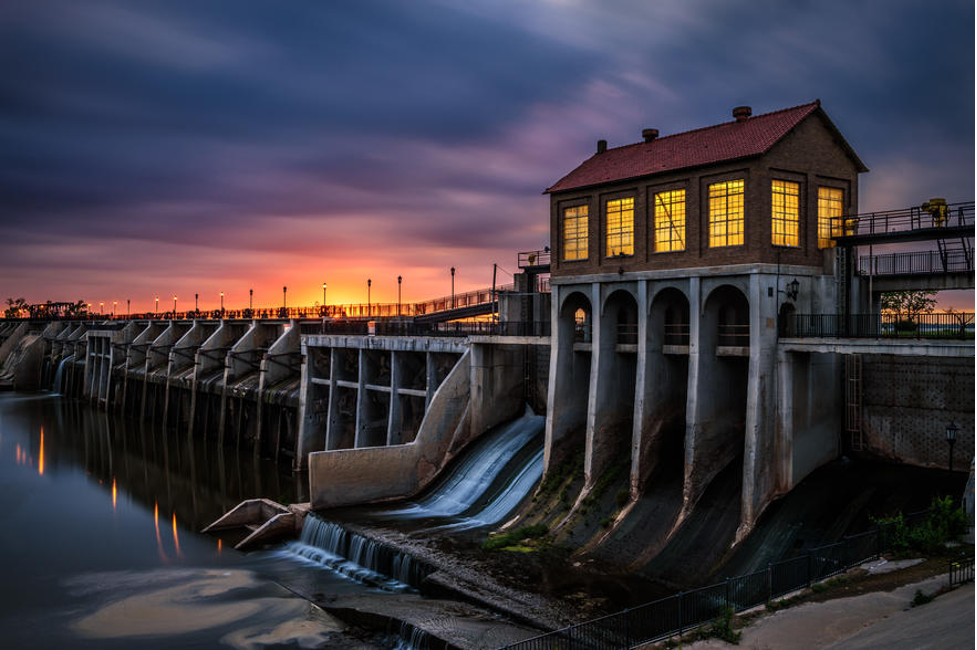
8. Oklahoma
Region: South-Central Extreme weather score: 59.2 Max temperature: 120°F Min temperature: −31°F Greatest 24-hr precipitation: 15.7 in Max 24-hr snowfall: 27.0 in Tornadoes per 10k sq mi: 9.0
Oklahoma sits in the heart of Tornado Alley with high annual tornado counts, big temperature swings, and intense spring and summer storms. Wildfire smoke, farm dust, and moist Gulf air keep air quality variable all year. A MERV 11 filter changed every 60 to 90 days is a strong baseline for most Oklahoma homes.
Shop Air Filters near Oklahoma
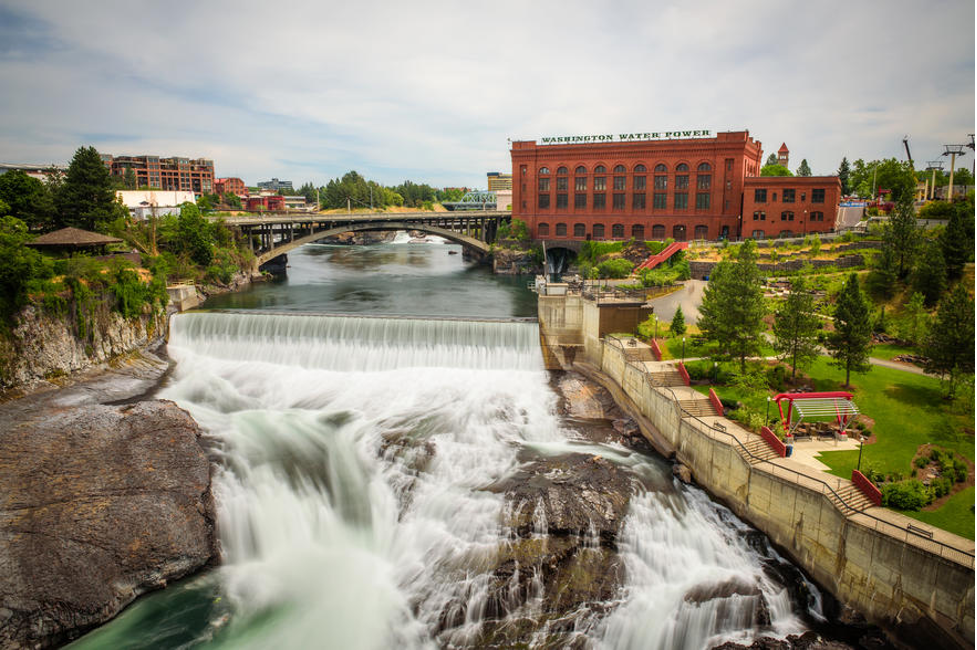
7. Washington
Region: Pacific Northwest Extreme weather score: 59.2 Max temperature: 118°F Min temperature: −48°F Greatest 24-hr precipitation: 14.3 in Max 24-hr snowfall: 65.0 in Tornadoes per 10k sq mi: 0.4
Washington blends Pacific coastal moisture with mountain extremes: wet, mild coastal winters and punishing snow in the Cascades and eastern regions. Wildfire smoke affects air quality seasonally, especially in summer and fall. A MERV 11 filter changed every 60 to 90 days is a solid baseline for most Washington homes.
Shop Air Filters near Washington
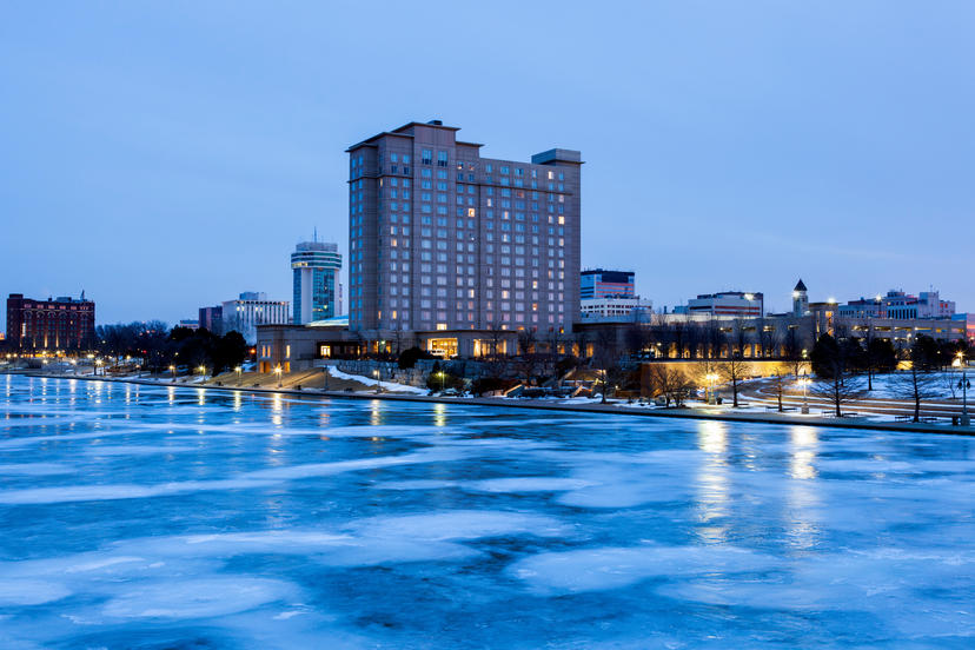
6. Kansas
Region: Great Plains Extreme weather score: 63.7 Max temperature: 121°F Min temperature: −40°F Greatest 24-hr precipitation: 12.6 in Max 24-hr snowfall: 30.0 in Tornadoes per 10k sq mi: 11.7
Kansas ranks among the top states for tornado frequency, with extreme temperature swings, severe spring thunderstorms, and heavy farm dust. Hail, high winds, and rapid pressure changes make air quality highly variable. A MERV 11 filter changed every 60 to 90 days is a strong baseline for most Kansas homes.
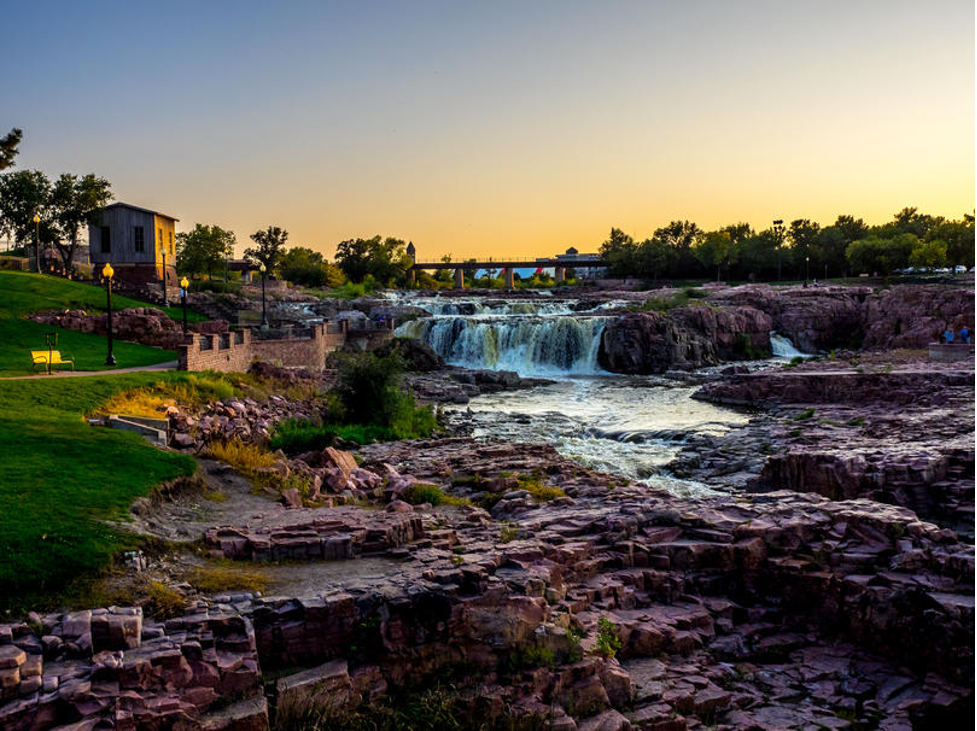
5. South Dakota
Region: Northern Plains Extreme weather score: 64.5 Max temperature: 120°F Min temperature: −58°F Greatest 24-hr precipitation: 8.7 in Max 24-hr snowfall: 52.0 in Tornadoes per 10k sq mi: 4.7
South Dakota endures brutal continental winters with record-low temperatures and heavy snow, followed by hot, dry summers and spring thunderstorms. Winter air stagnation traps contaminants, while spring and fall bring pollen and dust. A MERV 11 filter changed every 60 to 90 days is a strong baseline for most South Dakota homes.
Shop Air Filters near South Dakota
4. Colorado
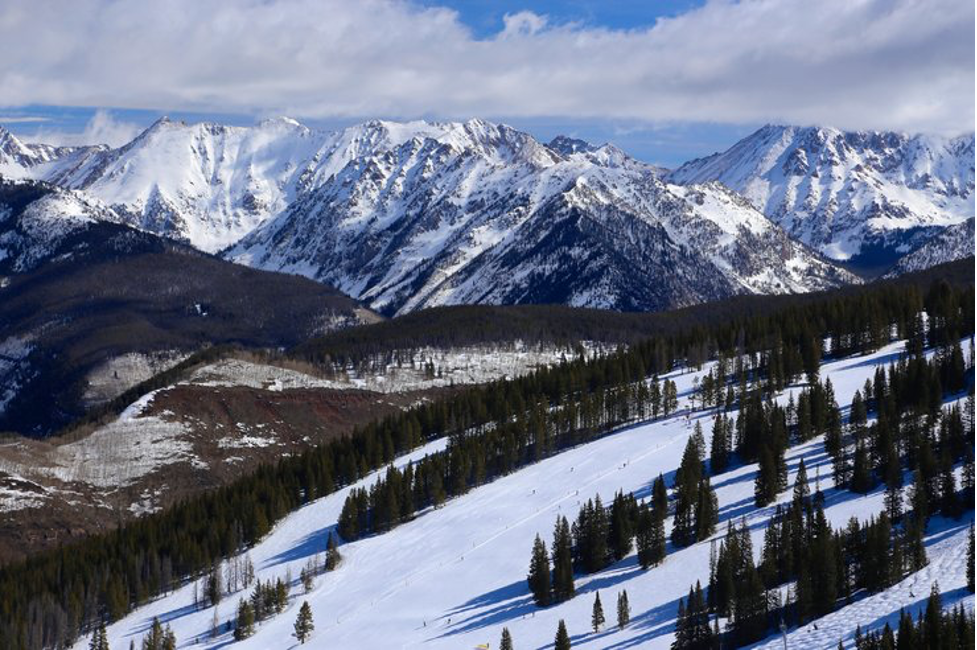
Region: Rocky Mountains Extreme weather score: 67.0 Max temperature: 115°F Min temperature: −61°F Greatest 24-hr precipitation: 11.9 in Max 24-hr snowfall: 75.8 in Tornadoes per 10k sq mi: 5.1
Colorado's high-altitude extremes bring record mountain snowfall, thin air at elevation, and seasonal wildfire smoke that drifts statewide. Conditions vary sharply by location, since Denver's lower elevation experiences very different air than mountain communities do. A MERV 11 filter changed every 60 to 90 days is a solid baseline for most Colorado homes.
Shop Air Filters near Colorado
3. Illinois
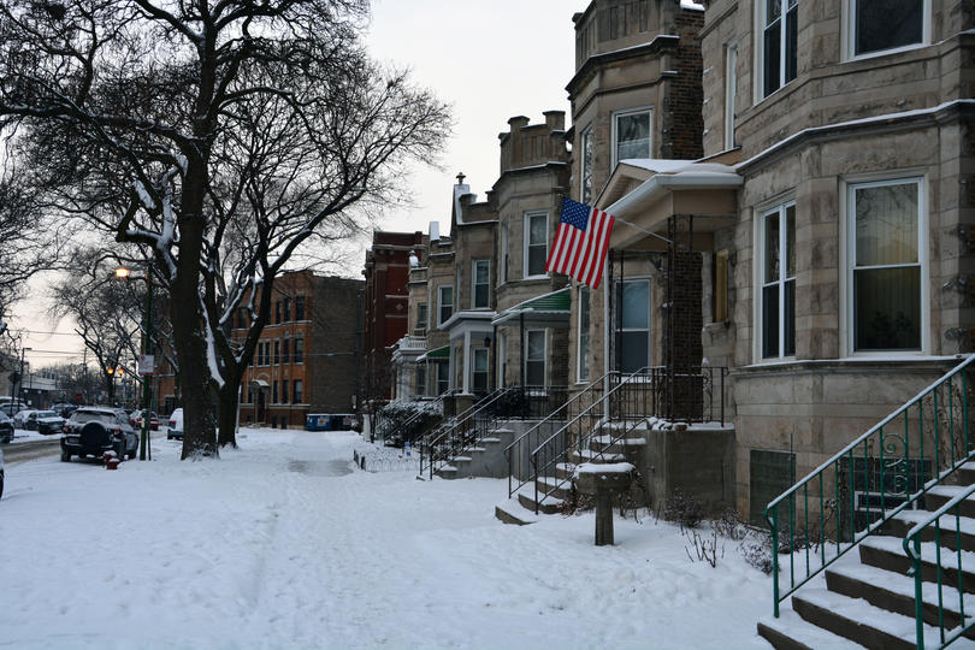
Region: Midwest Extreme weather score: 67.8 Max temperature: 117°F Min temperature: −38°F Greatest 24-hr precipitation: 16.9 in Max 24-hr snowfall: 36.0 in Tornadoes per 10k sq mi: 9.7
Illinois lies in the path of severe weather systems, with high tornado frequency, wide temperature swings, heavy spring storms, and significant winter snow. Lake Michigan shapes air quality near the coast, while interior regions deal with farm dust and pollen surges. A MERV 11 filter changed every 60 to 90 days is a strong baseline for most Illinois homes.
Shop Air Filters near Illinois
2. Minnesota
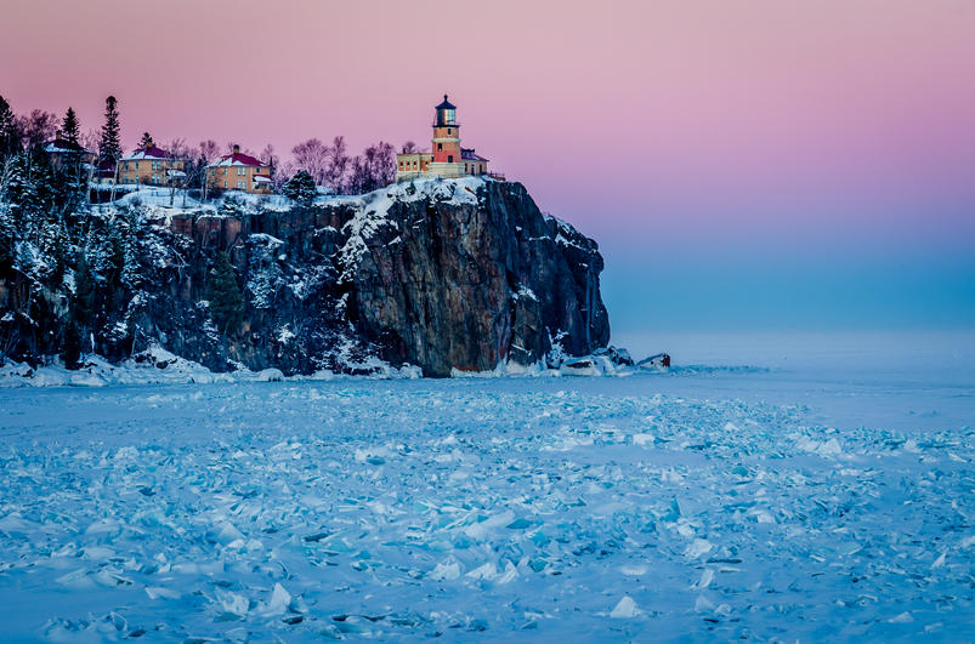
Region: Upper Midwest Extreme weather score: 68.6 Max temperature: 115°F Min temperature: −60°F Greatest 24-hr precipitation: 15.1 in Max 24-hr snowfall: 36.0 in Tornadoes per 10k sq mi: 5.7
Minnesota sees some of the nation's coldest winter extremes, heavy snow, and Lake Superior's influence on coastal air quality. Summer humidity and spring pollen add seasonal stress, and winter air stagnation traps contaminants during cold snaps. A MERV 11 filter changed every 60 to 90 days is a strong baseline for most Minnesota homes.
Shop Air Filters near Minnesota
1. California
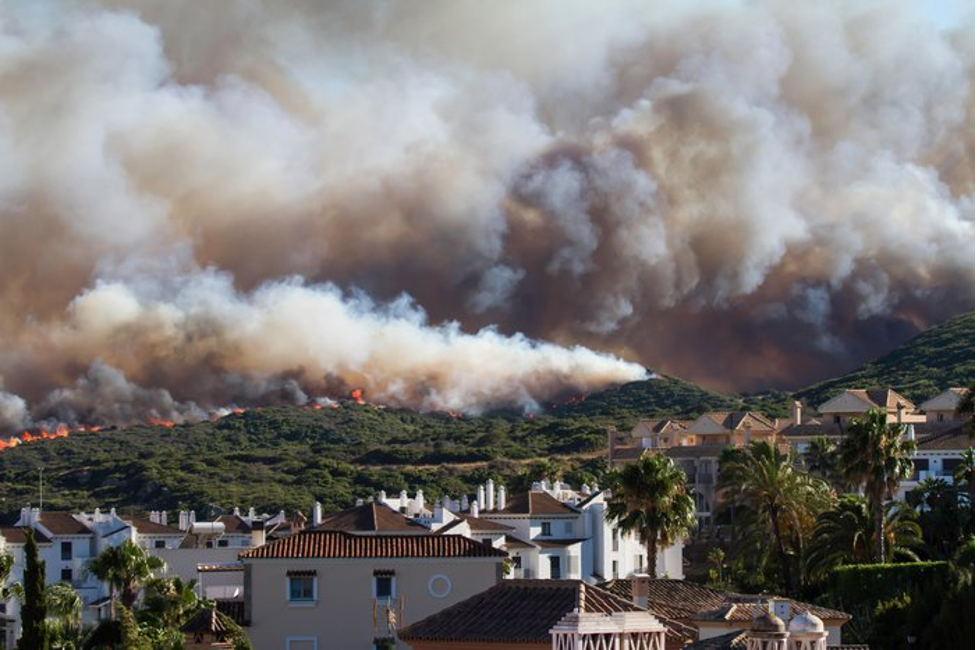
Region: West Coast Extreme weather score: 73.1 Max temperature: 134°F Min temperature: −45°F Greatest 24-hr precipitation: 25.8 in Max 24-hr snowfall: 67.0 in Tornadoes per 10k sq mi: 0.7
California tops the list with wildly divergent climates: Death Valley's record heat, Sierra Nevada snowfall, a coastal marine layer, and some of the worst wildfire smoke in the country. In 2025, the Eaton and Palisades Fires ranked among the most destructive in state history. Regional differences are stark, ranging from desert dust to coastal fog. A MERV 11 filter changed every 60 to 90 days is a solid baseline for most California homes.
Shop Air Filters near California
Methodology & Detailed Findings
To identify the states with the most extreme weather, researchers at Filterbuy built a composite score using five equally weighted factors:
All-time maximum temperature
All-time minimum temperature
All-time greatest 24-hour precipitation
All-time maximum 24-hour snowfall
Annual tornadoes per 10,000 square miles
All data comes from the National Centers for Environmental Information State Climate Extremes Committee Records.
Frequently Asked Questions
What Makes a State’s Weather “Extreme”?
Extreme weather comes down to how far conditions swing from the norm and how often. Our scoring looks at record high and low temperatures, the heaviest single-day rain and snow totals, and tornado frequency relative to state size. States that score high on several of these factors (such as California, Minnesota, and Illinois) rank highest. No single record is enough; it's the combination of heat, cold, precipitation, snow, and storms that drives a state's ranking.
How Does Extreme Weather Affect Indoor Air Quality?
More than most people realize. Wildfire smoke, agricultural dust, high pollen counts, and stagnant winter air send fine particles into your home through windows, doors, and your HVAC system. Temperature swings and storm systems can also spike humidity, encouraging mold and dust mites. In states with big seasonal shifts, indoor air quality can change dramatically month to month, so filtration matters year-round.
What MERV Rating Should I Use in a High-Weather-Risk State?
For most homes in weather-variable states, a MERV 11 filter is a smart baseline. It captures fine dust, pollen, and much of the smoke that drifts indoors without straining a typical residential HVAC system. If you deal with heavy wildfire smoke or someone in your home has allergies or asthma, a MERV 13 offers extra protection. Just confirm your system can handle the higher rating before switching.
How Often Should I Change My Air Filter?
Every 60 to 90 days is a solid rule of thumb for a standard 1-inch filter. In extreme-weather states, you may need to swap it more often. During wildfire season, heavy pollen months, or stretches of constant heating or cooling, check it monthly and replace it when it looks gray or clogged. Pets, allergies, and higher MERV ratings can all shorten the ideal replacement window.
Which States Have the Most Extreme Weather in the u.s.?
Based on our composite scoring, California ranks first, followed by Minnesota, Illinois, Colorado, and South Dakota. These states combine multiple extremes: record heat and cold, heavy precipitation, deep snow, and, in several cases, frequent tornadoes. The full top 15 also includes Kansas, Washington, Oklahoma, New Mexico, Missouri, Montana, Nebraska, Texas, Iowa, and Maryland.
Is Extreme Weather Really Getting Worse?
The data says yes. The USCEI ran 58% above average in 2025, the 12th-highest in 116 years of records. Billion-dollar disasters have surged from about 9 per year historically to an average of 23 per year between 2020 and 2024, with total damages since 1980 now topping $3.1 trillion across 431 events. Rising development in vulnerable areas plays a role, but so does a clear shift toward more frequent and intense extremes.
Can an Air Filter Protect Me From Wildfire Smoke?
A quality filter helps significantly, though it's one part of a broader strategy. A MERV 11 or MERV 13 filter captures much of the fine particulate matter (PM2.5) in wildfire smoke as air cycles through your HVAC system. During heavy smoke events, keep windows closed, run your system's fan to keep air moving through the filter, and replace it more often since smoke clogs filters quickly. A portable air purifier with a HEPA filter can also supplement your central system.