July 23, 2026

By David Heacock
The size of new single-family homes has increased substantially in the last few decades. However, a recent trend in slightly smaller homes that began several years ago might be reversed by the COVID-19 pandemic. As homebuyers spend more time at home, they are seeking houses with more space. According to data from Realtor.com, the median size of residential listings in the U.S. was 1,838 square feet in 2020, but home sizes vary widely by market.
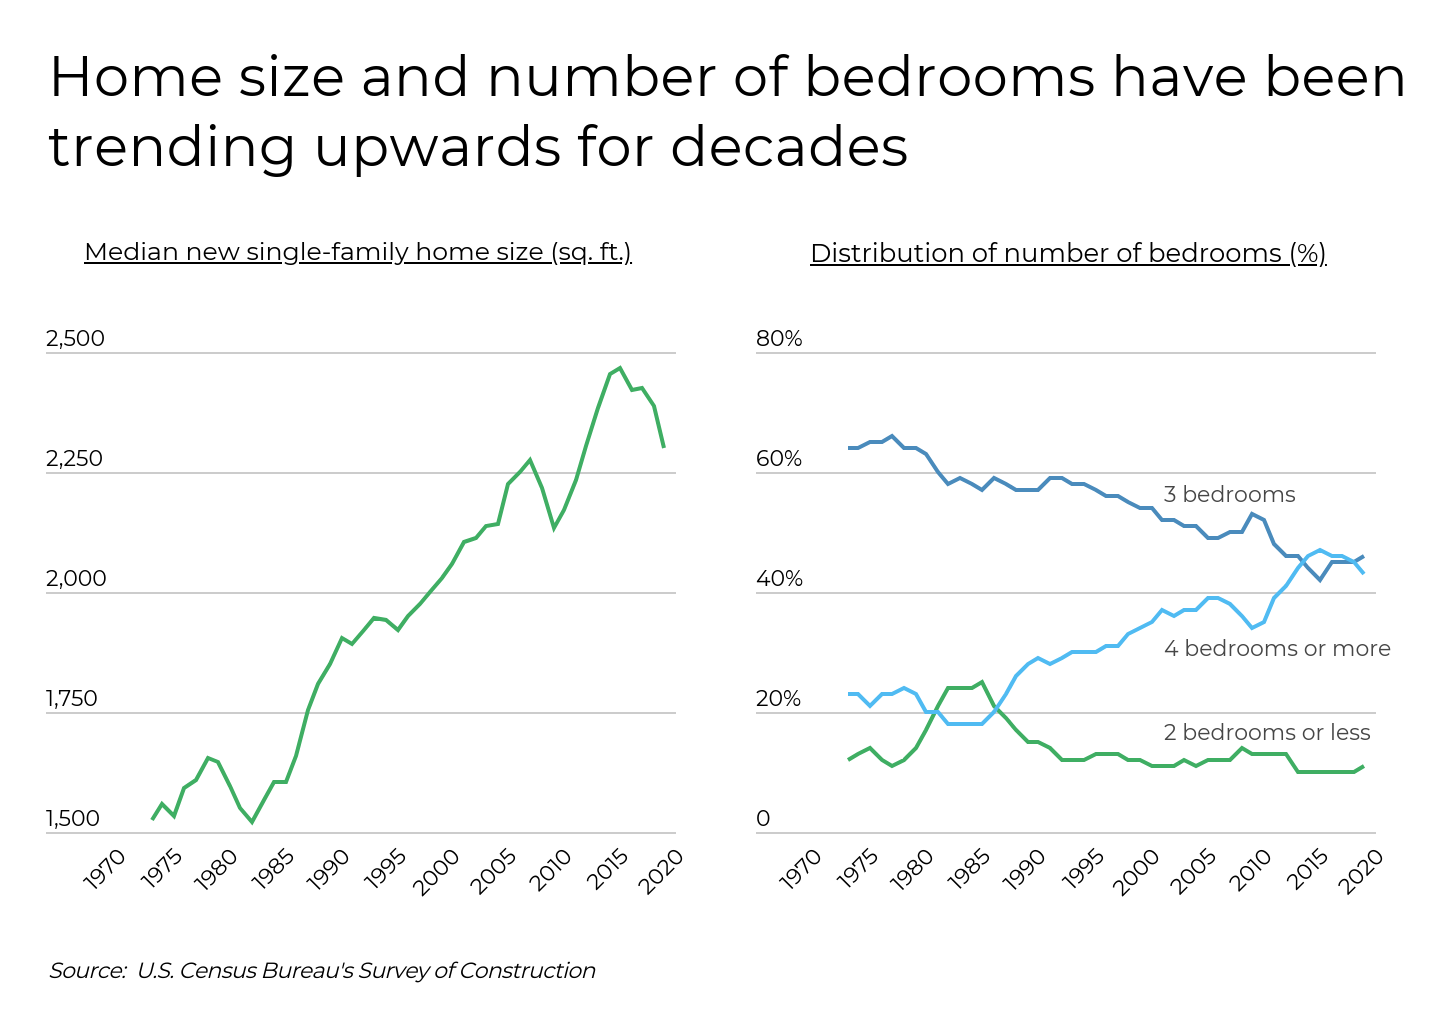
Census Bureau data on new home construction shows that the median size of new single-family homes increased by more than 50 percent over the last several decades, from 1,525 square feet in 1973 to a peak of 2,467 square feet in 2015. At the same time, homes with four or more bedrooms became much more common. Beginning in 2016, as more millennials entered the real estate market, the demand for more affordable, smaller homes started to grow. As a result, the median size of new homes trended downward in the years leading up to COVID-19. But now, as people spend more time at home, residences with more space—including room for a home office or gym—are more desirable again.
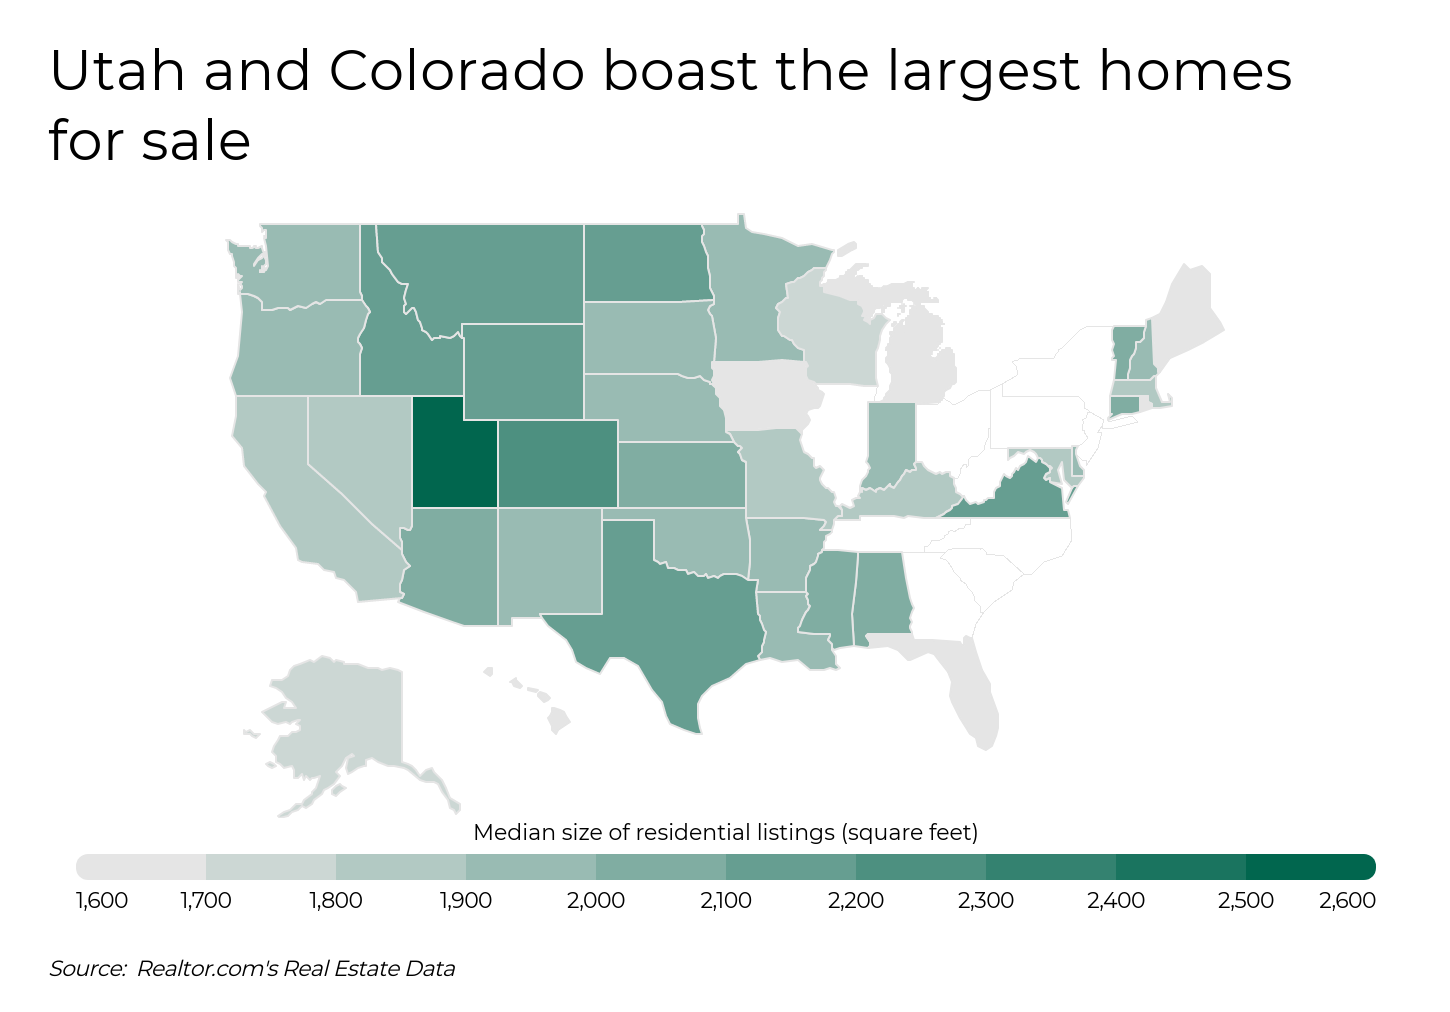
Home sizes vary substantially across the U.S. In more densely populated areas with high housing costs, small homes are the norm. The same is also true in less affluent areas where owning a larger home is not feasible. On the other hand, homes in more affluent suburban or rural areas tend to be larger. At the state level, Utah and Colorado boasted the largest homes for sale in 2020, with median residential listing sizes of 2,574 square feet and 2,286 square feet, respectively. Conversely, Hawaii reported the smallest homes for sale at just 1,201 square feet.
RELATED Keep the air inside your home healthy and clean by replacing your home air filters every 3 months. For the best protection, check out Filterbuy’s MERV 13 air filters.
To find the metropolitan areas with the largest and smallest homes, researchers at Filterbuy analyzed the latest data from Realtor.com and the U.S. Census Bureau. The researchers ranked metro areas according to the median size of residential listings. Researchers also calculated the median list price, the median price per square foot, and median household income.
To improve relevance, only metropolitan areas with at least 100,000 people were included in the analysis. Additionally, metro areas were grouped into the following cohorts based on population size:
Small metros: 100,000–349,999
Midsize metros: 350,000–999,999
Large metros: 1,000,000 or more
Here are the metropolitan areas with the largest and smallest homes.
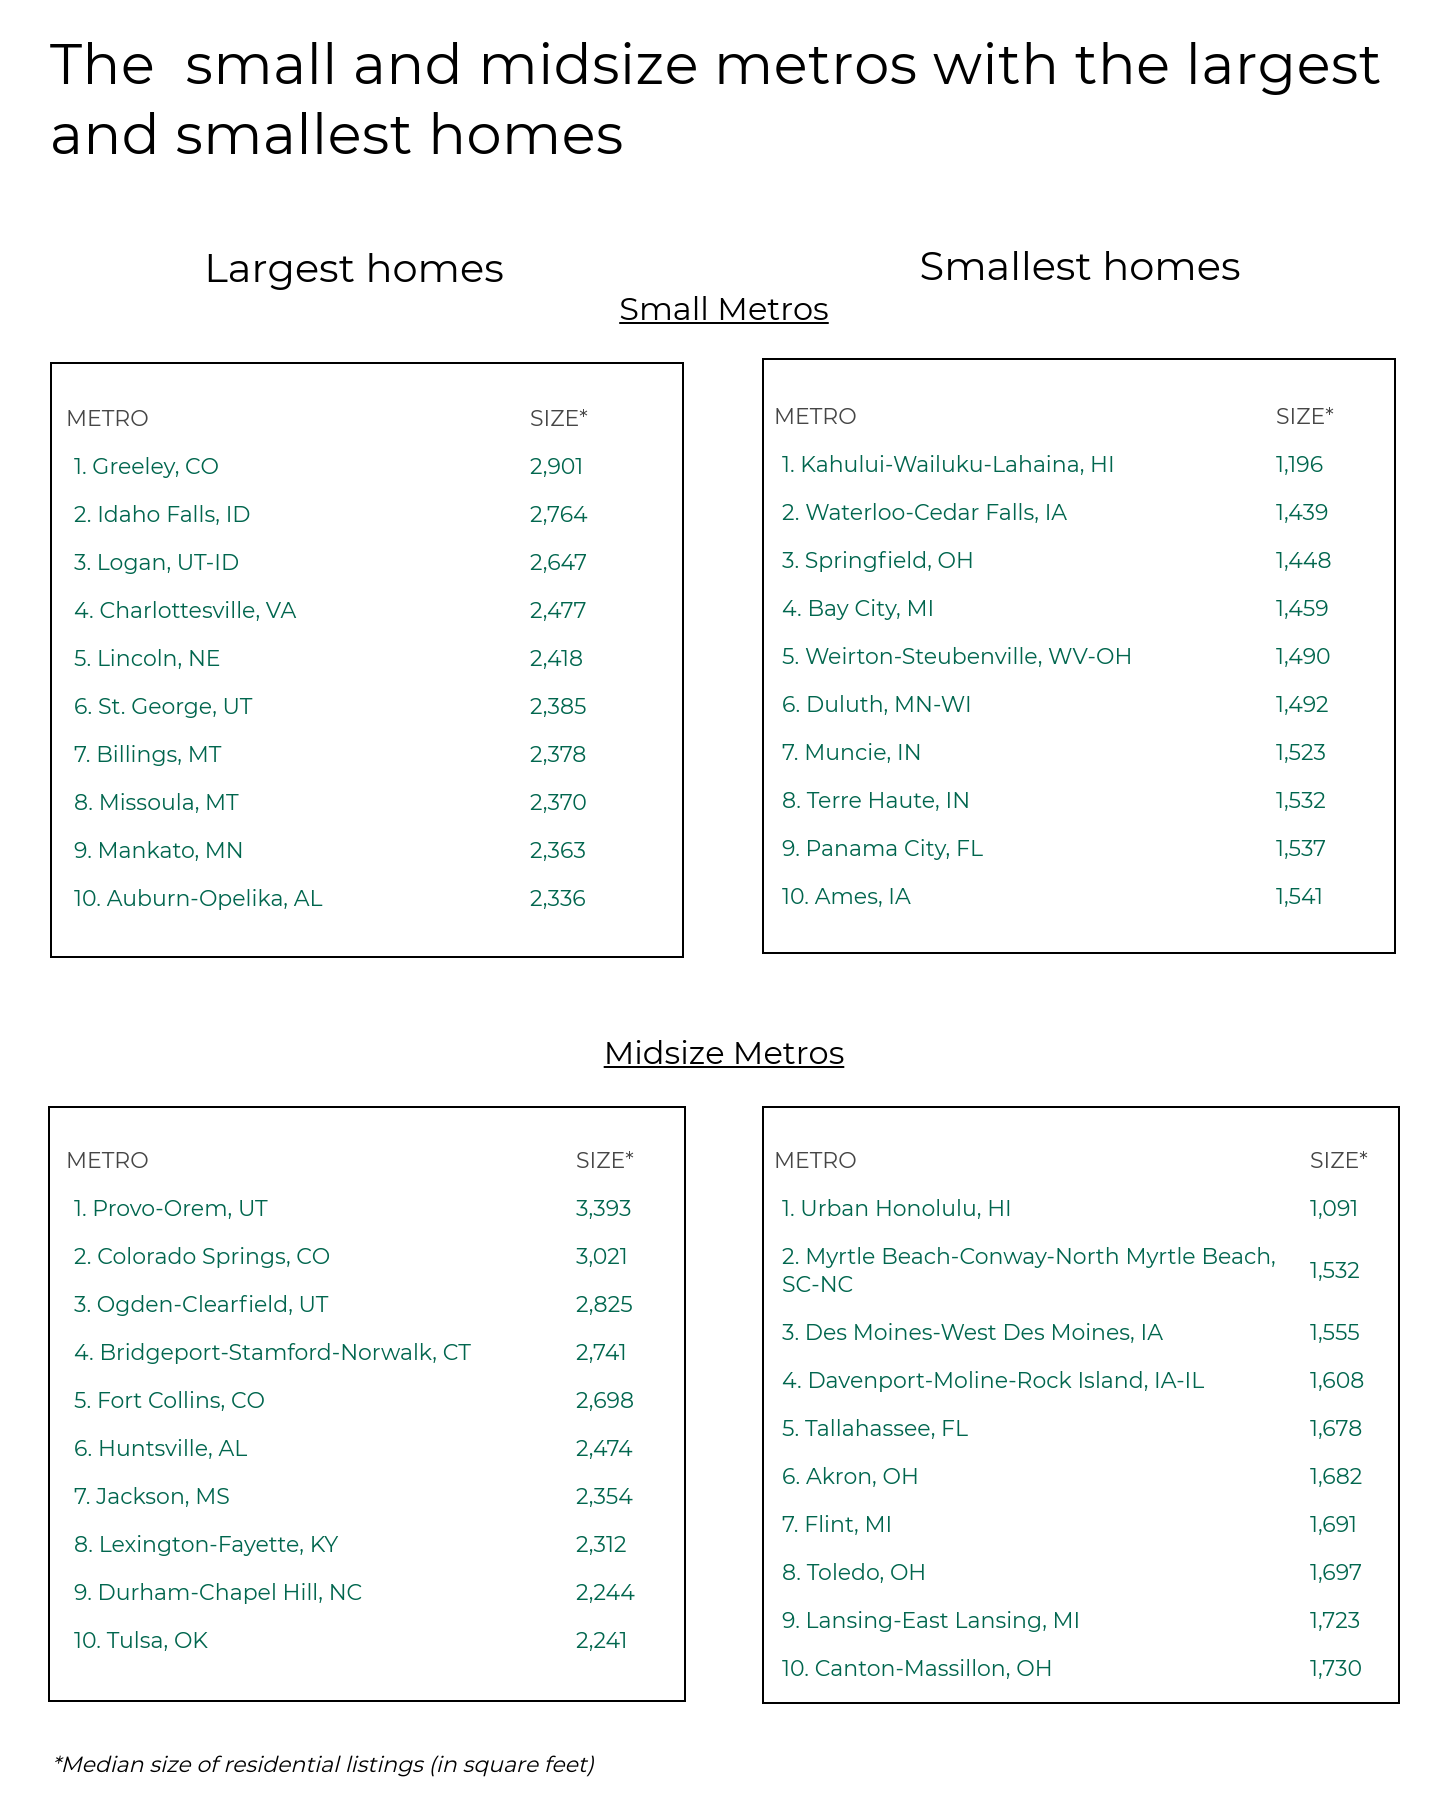

Photo Credit: Alamy Stock Photo
Median size of residential listings: 2,664 square feet
Median list price: $491,641
Median price per square foot: $192
Median household income: $80,196

Photo Credit: Alamy Stock Photo
Median size of residential listings: 2,483 square feet
Median list price: $379,603
Median price per square foot: $155
Median household income: $80,096

Photo Credit: Alamy Stock Photo
Median size of residential listings: 2,415 square feet
Median list price: $539,343
Median price per square foot: $234
Median household income: $85,641

Photo Credit: Alamy Stock Photo
Median size of residential listings: 2,368 square feet
Median list price: $322,238
Median price per square foot: $137
Median household income: $69,193

Photo Credit: Alamy Stock Photo
Median size of residential listings: 2,331 square feet
Median list price: $358,396
Median price per square foot: $153
Median household income: $66,399

Photo Credit: Alamy Stock Photo
Median size of residential listings: 2,320 square feet
Median list price: $351,329
Median price per square foot: $152
Median household income: $72,265

Photo Credit: Alamy Stock Photo
Median size of residential listings: 2,308 square feet
Median list price: $283,612
Median price per square foot: $114
Median household income: $62,502

Photo Credit: Alamy Stock Photo
Median size of residential listings: 2,294 square feet
Median list price: $338,776
Median price per square foot: $146
Median household income: $70,215

Photo Credit: Alamy Stock Photo
Median size of residential listings: 2,246 square feet
Median list price: $387,495
Median price per square foot: $176
Median household income: $70,262

Photo Credit: Alamy Stock Photo
Median size of residential listings: 2,218 square feet
Median list price: $301,436
Median price per square foot: $145
Median household income: $62,355

Photo Credit: Alamy Stock Photo
Median size of residential listings: 1,386 square feet
Median list price: $406,290
Median price per square foot: $265
Median household income: $60,141

Photo Credit: Alamy Stock Photo
Median size of residential listings: 1,611 square feet
Median list price: $999,365
Median price per square foot: $614
Median household income: $114,696

Photo Credit: Alamy Stock Photo
Median size of residential listings: 1,651 square feet
Median list price: $256,658
Median price per square foot: $148
Median household income: $63,474
Photo Credit: Alamy Stock Photo
Median size of residential listings: 1,685 square feet
Median list price: $218,437
Median price per square foot: $131
Median household income: $60,105

Photo Credit: Alamy Stock Photo
Median size of residential listings: 1,697 square feet
Median list price: $1,196,303
Median price per square foot: $725
Median household income: $130,865

Photo Credit: Alamy Stock Photo
Median size of residential listings: 1,728 square feet
Median list price: $405,592
Median price per square foot: $235
Median household income: $70,967

Photo Credit: Alamy Stock Photo
Median size of residential listings: 1,740 square feet
Median list price: $292,308
Median price per square foot: $164
Median household income: $57,906

Photo Credit: Alamy Stock Photo
Median size of residential listings: 1,761 square feet
Median list price: $237,036
Median price per square foot: $126
Median household income: $62,104

Photo Credit: Alamy Stock Photo
Median size of residential listings: 1,762 square feet
Median list price: $322,224
Median price per square foot: $167
Median household income: $74,533

Photo Credit: Alamy Stock Photo
Median size of residential listings: 1,763 square feet
Median list price: $238,921
Median price per square foot: $128
Median household income: $66,417
The metros with the largest homes are less densely populated and tend to be more affordable than some more densely populated urban areas. The median size of residential listings in the large metros with the biggest homes is 2,356 square feet, substantially larger than the national median of 1,838 square feet. However, the median residential listing price among these locations is only about 10 percent higher than the national median of $334,081. Homeowners in these metros also tend to report above-average income.
The metros with the smallest homes include a mix of expensive cities with high housing costs and also less affluent areas. Residents of these cities are either faced with extremely high home costs—the median price per square foot is $725 in the San Jose metro area—or are less able to afford larger, more expensive homes—median household income in Flint, MI is about $50,000.
To determine the metros with the largest and smallest homes, researchers at Filterbuy analyzed the latest data from Realtor.com and the U.S. Census Bureau’s 2019 American Community Survey (ACS). The researchers ranked metro areas according to the median size of residential listings, calculated as the average of the monthly 2020 Realtor.com data for median listing size. In the event of a tie, the metro with the larger median residential listing size for January, 2021 was ranked higher. Data on median list price and median price per square foot is also from Realtor.com. Data on median household income was sourced from the ACS. Due to insufficient residential listing data, some metros and states were excluded from the analysis.
Only metropolitan areas with at least 100,000 people were included in the analysis. Additionally, metro areas were grouped into the following cohorts based on population size:
Small metros: 100,000–349,999
Midsize metros: 350,000–999,999
Large metros: 1,000,000 or more