Every summer, smoke from Alaska, Canada, and the Southwest reaches cities like New York and Chicago, pushing air quality into dangerous territory for millions of people who never see a flame. Eight of the ten most expensive wildfires on record have occurred since 2017, and the trend is getting worse.
Understanding which states burn most isn't just about fire safety. It's about knowing when your indoor air is at risk and what to do about it.
2025 Data · NIFC Annual Report
Top States Affected by Wildfires
Ranked by total acres burned in 2025. Wildfire smoke from these states can reach homes across the entire country — including yours.
5.1M
Acres burned nationally
77,850
Total fires
18,385
Structures destroyed
85%
Human-caused fires
#
State
Acres Burned
Acres
Fires
1
Alaska ↑ Most acres
Remote boreal & tundra fires
1,680,000
595
2
Arizona
Desert & mountain fires, drought-driven
678,000
1,432
3
California 16,512 structures lost
Palisades & Eaton fires, Jan 2025
525,223
8,036
4
Oregon
Cascade Range & coast range fires
338,551
2,117
5
Florida
Subtropical dry season, post-hurricane fuels
228,183
2,913
6
Oklahoma 300+ homes lost
Plains wind event, March 2025
170,000
2,811
7
Utah
Above-avg heat, low humidity conditions
164,874
1,159
Wildfire smoke travels thousands of miles. If your state is on this list — or downwind of one that is — a MERV 13 filter is the minimum recommended protection for your indoor air.
Shop MERV 13 Filters →
Wildfires are no longer just a West Coast problem. Smoke carries fine particulate matter (PM2.5) thousands of miles: in 2023, Canadian wildfire smoke pushed New York City's AQI above 400. Eight of the ten most expensive wildfires on record have occurred since 2017, and the trend is getting worse.
Understanding which states burn most isn't just about fire safety. It's about knowing when your indoor air is at risk and what to do about it.
January 2025 · Southern California
The 2025 California Wildfires: A Devastating Start to the Year
The season opened with several destructive blazes driven by record drought and extreme Santa Ana winds — some of the most damaging fires in California history.
Palisades Fire
January 7, 2025 · Pacific Palisades & Malibu
Acres burned
23,448
Structures destroyed
6,800+
Fatalities
11
Eaton Fire
January 7, 2025 · Pasadena & Altadena
Acres burned
14,021
Structures destroyed
9,400+
Fatalities
17
Hughes Fire
January 22, 2025 · Castaic Lake
Acres burned
10,425
Outcome
Mass evacuations
Border 2 Fire
January 23, 2025 · San Diego County
Acres burned
6,625
Outcome
Emergency evacuations
What's driving this? An ongoing megadrought and record-low rainfall have created near-permanent fire conditions across Southern California. Fires that once peaked in summer now ignite in January — and the smoke reaches every region of the country.
NIFC Data · 2001–2024
Wildfire Causes: Human vs. Natural Factors
People start nearly 9 in 10 wildfires — but lightning-caused fires tend to burn more land. Understanding both is key to understanding wildfire risk.
89%
of wildfires are human-caused
Campfires, power lines, debris burns, arson, and cigarettes account for the vast majority of ignitions nationwide.
53%
of acres burned come from lightning
Lightning fires ignite in remote areas and burn longer before suppression — making them larger on average, even though they're rarer.
Acres Burned by Cause, 2015–2024
Millions of acres · Source: National Interagency Fire Center
Common human causes of wildfires
Unattended campfires
Power line failures
Debris burning
Arson
Cigarettes
Equipment sparks
Fireworks
Vehicle exhaust
Source: National Interagency Fire Center · Congressional Research Service (2018–2022 averages)
The severity of wildfires is largely affected by climate conditions, and in 2021, several western states remain trapped in a persistent “megadrought.” Large portions of the region—including parts of Utah, Arizona, Nevada, California, New Mexico, Colorado, and Oregon—face “exceptional” levels of drought, which is the U.S. Drought Monitor's most severe category.
Canadian Wildfires
In June 2023, smoke from hundreds of active Canadian wildfires pushed New York City's AQI above 400 — classified as "hazardous." States as far south as Pennsylvania and Maryland issued air quality alerts. It was a stark reminder that wildfire smoke doesn't stop at borders.
California Wildfires
California leads the nation in wildfire exposure: 2.1 million homes are at risk — nearly three times more than Texas (750,000) or Colorado (380,000). But raw numbers don't tell the whole story. In Montana and Idaho, a quarter to a third of all properties sit in fire-prone areas, compared to just 15% in California.
To rank the states below, we used acres burned as the primary metric, sourced from the National Interagency Fire Center and U.S. Census Bureau.
✓
Official EPA Guidance
"During smoky periods, upgrading to an HVAC filter rated MERV 13 or higher is recommended to effectively remove fine particle pollution from smoke in the indoor air."
— U.S. Environmental Protection Agency · Preparing for Smoke and Heat
95%
of wildfire smoke particles captured by MERV 13
0.3µm
smallest particle size filtered — smaller than PM2.5
30×
more effective than standard fiberglass filters
What to do when AQI rises above 150
1
Upgrade to MERV 13. Standard MERV 8 filters don't capture PM2.5 — the fine particles that make wildfire smoke dangerous.
2
Set HVAC to recirculate. Avoid drawing in fresh outdoor air during smoke events. Close fresh-air intakes if your system has one.
3
Check filters monthly. Heavy smoke can clog a MERV 13 in 30–60 days. Replace when it appears dark brown or black.
4
Keep spares on hand. During active fire events, filters sell out fast. Stock an extra before fire season starts.
EPA-Recommended Protection
Ready before the next smoke event?
Filterbuy MERV 13 filters ship factory-direct, free. Set up auto-delivery and never get caught without one.
Shop MERV 13 Filters →
Here are the 15 states that were hit hardest by wildfires last year and the data behind each.
U.S. States Most Impacted by Wildfires in 2025
15. Nevada
State · Land area: 109,894 sq mi
Primary Pollutant
PM2.5
wildfire smoke + ozone
Total Acres Burned
395,265
2025 season
Total Number of Fires
690
2025 season
Burned as % of Land Area
0.56%
of 109,894 sq mi
Human-Caused Acres
20,921
2025 season
Top Human Causes
Equipment use, debris burning, fireworks
Air quality note
Nevada experienced its worst wildfire season since 2020 in 2025, with 690 fires scorching over 395,000 acres — fueled by drought, invasive cheatgrass, and lightning strikes across the Great Basin. Wildfire smoke blanketed Reno, Las Vegas, and surrounding communities for extended stretches, driving PM2.5 levels into unhealthy ranges and prompting public health alerts statewide. For Nevada homeowners, smoke-loaded air seasons mean HVAC filters need more frequent changes — a MERV 11 filter is the recommended baseline, and upgrading to MERV 13 is advised during any AQI event above 100 or when regional fires are active. Shop MERV Filters →
14. Kentucky
State · Land area: 39,486 sq mi
Primary Pollutant
PM2.5
smoke + industrial emissions
Total Acres Burned
59,199
2025 season
Total Number of Fires
1,280
2025 season
Burned as % of Land Area
0.2%
of 39,486 sq mi
Human-Caused Acres
59,198
99% of total burned
Top Human Causes
Arson, escaped debris burning, campfires
Air quality note
Kentucky's 2025 wildfire season burned nearly 60,000 acres — nearly all of it human-caused, with arson and escaped debris fires the leading culprits across the state's 12 million acres of hardwood forests. Wildfire smoke compounds Kentucky's existing air quality challenges, where PM2.5 and ground-level ozone already push several counties into the "unhealthy" range annually. For Kentucky homeowners, fall and spring fire seasons mean recurring smoke intrusion — a MERV 11 filter is the recommended baseline for most homes, and upgrading to MERV 13 is advised during any active fire event or AQI above 100. Shop MERV Filters →
13. Nebraska
State · Land area: 76,824 sq mi
Primary Pollutant
PM2.5
wildfire smoke + ozone
Total Acres Burned
981,502+
2025 season (record)
Total Number of Fires
568
2025 season
Burned as % of Land Area
2.0%+
of 76,824 sq mi
Human-Caused Acres
71,121
per available data
Top Human Causes
Debris burns, equipment sparks, escaped prescribed burns
Air quality note
Nebraska's 2025 wildfire season was the worst on record, with nearly 1 million acres burned — driven by extreme drought, 70+ mph winds, and critically dry grassland fuels across the Sandhills and western plains. The Morrill Fire alone consumed over 643,000 acres, blanketing communities across the state with hazardous PM2.5 smoke for days at a time. For Nebraska homeowners, spring fire season means recurring smoke intrusion even in urban areas like Omaha — a MERV 11 filter is the recommended baseline, and upgrading to MERV 13 is advised during any active fire event or AQI above 100. Shop MERV Filters →
12. Kansas
State · Land area: 81,758 sq mi
Primary Pollutant
Ozone
+ wildfire smoke PM2.5
Total Acres Burned
84,015
2025 season
Total Number of Fires
67
2025 season
Burned as % of Land Area
0.2%
of 81,758 sq mi
Human-Caused Acres
80,089
95.3% of total burned
Top Human Causes
Equipment sparks, unattended campfires, debris burns
Air quality note
Kansas wildfires are driven by explosive spring conditions — dry frontal passages, 60+ mph wind gusts, and parched prairie grasses can spread fire across tens of thousands of acres within hours. Nearly 95% of acres burned are human-caused, with equipment sparks and unattended burns the leading culprits. Wildfire smoke routinely pushes air quality into unhealthy ranges across Wichita, Kansas City, and rural communities — compounding the state's existing ozone problem. For Kansas homeowners, spring fire season means recurring smoke intrusion — a MERV 11 filter is the recommended baseline, and upgrading to MERV 13 is advised during any active fire event or AQI above 100. Shop MERV Filters →
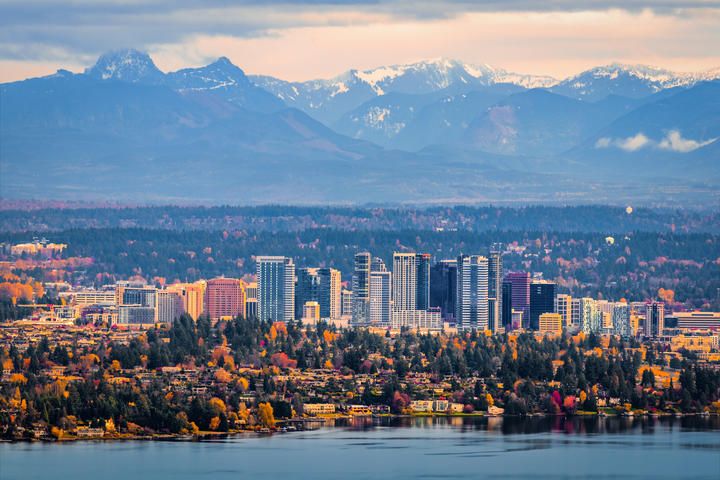
11. Washington
State · Land area: 66,456 sq mi
Primary Pollutant
PM2.5
wildfire smoke
Total Acres Burned
~251,840
2025 season
Total Number of Fires
~1,900
2025 season
Burned as % of Land Area
0.59%
of 66,456 sq mi
Human-Caused Acres
105,550
per available data
Top Human Causes
Campfires, equipment sparks, arson, debris burning
Air quality note
Washington's 2025 wildfire season burned approximately 251,840 acres across nearly 1,900 ignitions — an above-average year driven by late-summer lightning storms, hot and dry conditions, and critically low moisture in Central and Eastern Washington. A "smokestorm" on September 5 produced the highest particulate levels ever recorded in the Seattle suburbs, reaching 300 micrograms per cubic meter. PM2.5 from wildfire smoke is Washington's dominant air quality threat, spiking year-round across the state. For Washington homeowners, fire season means prolonged smoke exposure — a MERV 11 filter is the recommended baseline, and upgrading to MERV 13 is advised during any active fire event or AQI above 100. Shop MERV Filters →
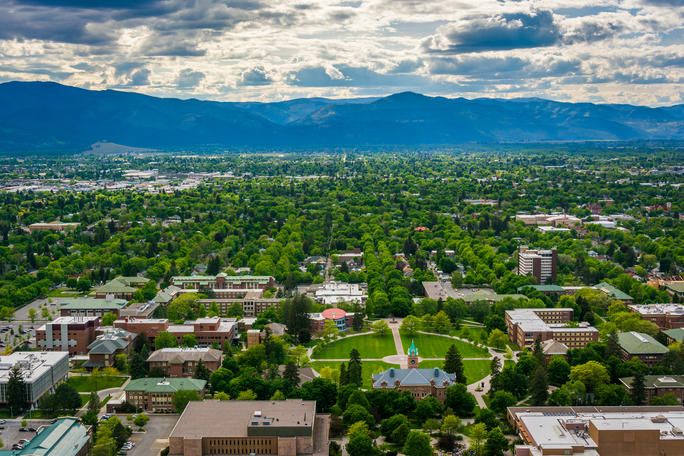
10. Montana
State · Land area: 145,546 sq mi
Primary Pollutant
PM2.5
wildfire smoke
Total Acres Burned
75,000
2025 season (4th lowest in 15 yrs)
Total Number of Fires
2,303
2025 season
Burned as % of Land Area
0.08%
of 145,546 sq mi
Human-Caused Acres
50,582
per available data
Top Human Causes
Debris burning, equipment sparks, unattended campfires
Air quality note
Montana's 2025 fire season was one of the mildest in recent memory — 75,000 acres burned across 2,303 fires, the fourth-lowest acreage in 15 years, thanks to a cooler, wetter summer and fast suppression response. Even so, wildfire smoke remains Montana's primary air quality threat, with PM2.5 spikes from even modest fires able to push Missoula, Billings, and surrounding communities into unhealthy ranges for days at a time. In high-smoke years, Montana's indoor air quality impact is severe — a MERV 11 filter is the recommended baseline for most Montana homes, and upgrading to MERV 13 is advised during any active fire event or AQI above 100. Shop MERV Filters →
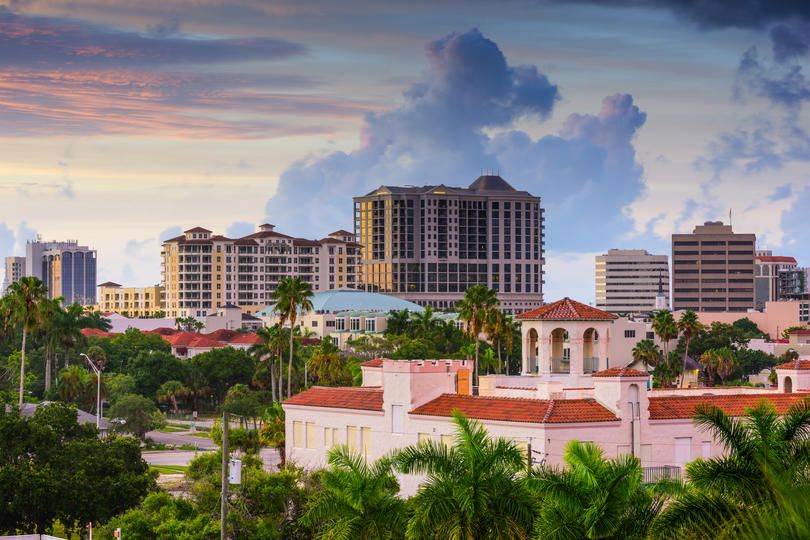
9. Florida
State · Land area: 53,625 sq mi
Primary Pollutant
PM2.5
wildfire smoke + ozone
Total Acres Burned
162,448+
2025 season (thru Oct)
Total Number of Fires
~3,100
2025 season
Burned as % of Land Area
0.48%+
of 53,625 sq mi
Human-Caused Acres
11,843
per available data
Top Human Causes
Debris burning, campfires, cigarettes, equipment sparks
Air quality note
Florida's 2025 wildfire season was notably active, with over 162,000 acres burned by early October — fueled by drought, hurricane debris, and lightning in the Everglades and flatwoods ecosystems. The largest single fire, the 48,000-acre Mile Marker 39 Fire in Broward County, drove dangerous PM2.5 spikes and health advisories across South Florida for weeks. Unlike western states, most large Florida fires are lightning-ignited, but smoke impacts are no less real for residents. With nearly half the state covered in forest and 1,000 new residents arriving daily, indoor air protection is increasingly critical — a MERV 11 filter is the recommended baseline, and upgrading to MERV 13 is advised during any active fire event or AQI above 100. Shop MERV Filters →
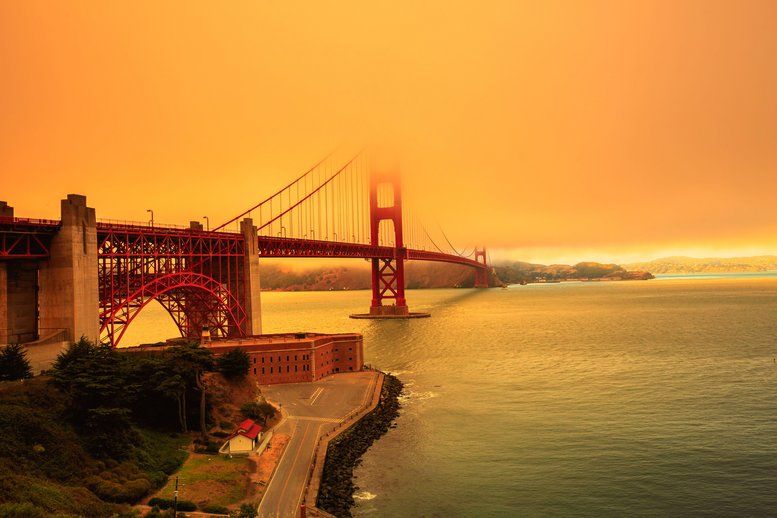
8. California
State · Land area: 155,779 sq mi
Primary Pollutant
PM2.5
wildfire smoke + ozone
Total Acres Burned
525,223
2025 season
Total Number of Fires
8,036
2025 season
Burned as % of Land Area
0.53%
of 155,779 sq mi
Human-Caused Acres
250,394
per available data
Top Human Causes
Power lines, arson, equipment sparks, unattended campfires
Air quality note
California's 2025 wildfire season was among the most destructive on record — beginning with the catastrophic January LA fires, where the Eaton and Palisades blazes killed 31 people, destroyed 18,000+ structures, and drove PM2.5 to 569 μg/m³ at peak, the most hazardous category. By year end, 8,036 fires had burned over 525,000 acres statewide. Wildfire smoke is California's primary driver of PM2.5 spikes, which stack on top of the state's chronic ozone problem. For California homeowners, year-round fire risk makes filter discipline critical — a MERV 11 filter is the recommended baseline, and upgrading to MERV 13 is essential during any active fire event or AQI above 100. Shop MERV Filters →
7. Oklahoma
State · Land area: 68,595 sq mi
Primary Pollutant
Ozone
+ wildfire smoke PM2.5
Total Acres Burned
355,133
2025 season
Total Number of Fires
2,811
2025 season
Burned as % of Land Area
0.8%
of 68,595 sq mi
Human-Caused Acres
383,950
incl. cross-border fires
Top Human Causes
Debris burning, equipment sparks, arson, escaped campfires
Air quality note
Oklahoma's 2025 fire season was defined by a catastrophic March storm event — 130+ simultaneous fires ignited by historic winds burned over 200,000 acres in days, destroyed 300+ homes, killed 4 people, and prompted a statewide emergency declaration. Oklahoma's peak fire season coincides with its ozone season (March–November), when wildfire smoke compounds the state's existing ozone and PM2.5 challenges. For Oklahoma homeowners, late-winter and spring fire events mean smoke can arrive suddenly and intensely — a MERV 11 filter is the recommended baseline, and upgrading to MERV 13 is advised during any active fire event or AQI above 100. Shop MERV Filters →
6. Arizona
State · Land area: 113,594 sq mi
Primary Pollutant
Ozone
+ wildfire smoke PM2.5
Total Acres Burned
331,629
2025 season
Total Number of Fires
1,608
2025 season
Burned as % of Land Area
0.73%
of 113,594 sq mi
Human-Caused Acres
71,535
per available data
Top Human Causes
Trailer chains, equipment sparks, campfires, debris burns
Air quality note
Arizona's 2025 wildfire season burned over 331,000 acres, highlighted by the Dragon Bravo Fire — a lightning-ignited megafire that consumed 145,504 acres on the Grand Canyon's North Rim and destroyed the historic Grand Canyon Lodge. Arizona's extreme sun exposure and drought conditions make it the #4 state nationally for unhealthy ozone days, and wildfire smoke adds dangerous PM2.5 spikes on top of existing ozone stress. For Arizona homeowners, year-round fire risk means HVAC filters should never be neglected — a MERV 11 filter is the recommended baseline, and upgrading to MERV 13 is advised during any active fire event or AQI above 100. Shop MERV Filters →
Our customer support team frequently helps homeowners in California, Oregon, and Washington choose the right filtration level for recurring smoke events. One of the most common questions we hear is whether a standard filter is “good enough” during fire season. The short answer: if you can smell smoke indoors, your current filter likely isn’t capturing the fine particles doing the most damage. For these states, we typically recommend upgrading to a MERV 13 filter during the May–October fire season window—and many of our West Coast customers now keep them installed year-round through auto-delivery.
5. Oregon
State · Land area: 95,988 sq mi
Primary Pollutant
PM2.5
wildfire smoke
Total Acres Burned
338,551
2025 season (below 10-yr avg)
Total Number of Fires
1,100+
2025 season (above 10-yr avg)
Burned as % of Land Area
0.55%
of 95,988 sq mi
Human-Caused Acres
56,201
62% of fires human-caused
Top Human Causes
Equipment use, debris burning, recreation, arson
Air quality note
Oregon's 2025 wildfire season burned 338,551 acres — well below the prior year's catastrophic 1.9 million acres, but still destroyed 205+ structures and pushed more fires dangerously close to communities. The season started with the Rowena Fire near The Dalles, which destroyed 56 homes in days. PM2.5 from wildfire smoke is Oregon's dominant air quality threat, with wildfire seasons starting earlier and lasting longer each decade. For Oregon homeowners — particularly in Central, Eastern, and Southern Oregon — summer smoke events can arrive with little warning and linger for weeks. A MERV 11 filter is the recommended baseline, and upgrading to MERV 13 is advised during any active fire event or AQI above 100. Shop MERV Filters →
4. Idaho
State · Land area: 82,643 sq mi
Primary Pollutant
PM2.5
wildfire smoke
Total Acres Burned
436,733
2022 baseline (2025 TBD)
Total Number of Fires
1,008
2022 baseline (2025 TBD)
Burned as % of Land Area
0.8%
of 82,643 sq mi
Human-Caused Acres
230,898
53% of total burned
Top Human Causes
Campfires, equipment sparks, arson, debris burning
Air quality note
Idaho's wildfire seasons are highly variable — 2024 scorched nearly 1 million acres while 2025 was notably quieter, costing the state $40.6 million in suppression expenses. Lightning storms are the dominant ignition source during peak season (July–August), while human activity drives most early and late-season fires. Wildfire smoke is Idaho's primary air quality threat, with PM2.5 spikes from central and northern Idaho fires regularly blanketing communities like Boise, Lewiston, and Coeur d'Alene. For Idaho homeowners, smoke events can arrive suddenly and persist for weeks — a MERV 11 filter is the recommended baseline, and upgrading to MERV 13 is advised during any active fire event or AQI above 100. Shop MERV Filters →
3. Texas
State · Land area: 261,232 sq mi
Primary Pollutant
Ozone
+ wildfire smoke PM2.5
Total Acres Burned
120,000+
2025 season (below avg)
Total Number of Fires
5,000+
2025 season (below avg)
Burned as % of Land Area
0.07%
of 261,232 sq mi
Human-Caused Acres
584,691
2022 baseline (9 in 10 fires)
Top Human Causes
Debris burning, equipment operation, campfires, arson
Air quality note
Texas's 2025 wildfire season was below average — roughly 5,000+ fires burning 120,000+ acres — a sharp contrast to 2024's Smokehouse Creek Fire, which set the state record at over 1 million acres in a single fire. While 2025 was relatively quiet, Texas ranks second nationally in homes at risk from wildfire, and nine out of ten fires are human-caused. Ozone is Texas's chronic air quality challenge across its major metros, while wildfire smoke from large grass fires drives dangerous PM2.5 spikes across the Panhandle, Hill Country, and West Texas. A MERV 11 filter is the recommended baseline, and upgrading to MERV 13 is advised during any active fire event or AQI above 100. Shop MERV Filters →
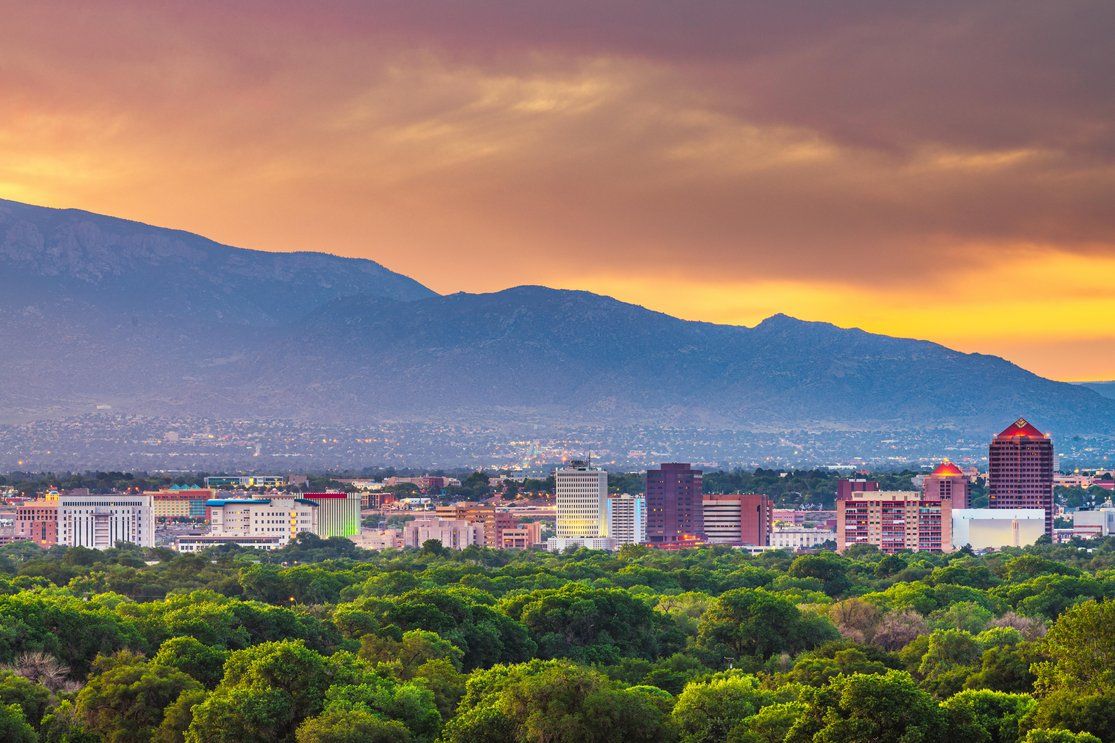
2. New Mexico
State · Land area: 121,298 sq mi
Primary Pollutant
PM2.5
wildfire smoke + ozone
Total Acres Burned
859,906
2022 baseline (incl. Hermit's Peak)
Total Number of Fires
748
2022 baseline
Burned as % of Land Area
1.1%
of 121,298 sq mi
Human-Caused Acres
847,283
incl. escaped prescribed burns
Top Human Causes
Escaped prescribed burns, campfires, equipment sparks, arson
Air quality note
New Mexico's 2022 season — reflected in the data above — was defined by the Hermit's Peak/Calf Canyon Fire, the largest in state history: an escaped U.S. Forest Service prescribed burn that consumed 342,000+ acres and destroyed 903 structures. The 2025 season was active but more typical, with the Buck Fire (57,753 acres) and Trout Fire (47,000 acres) driving emergency declarations and evacuations across the Gila National Forest. Wildfire smoke is New Mexico's most acute air quality event driver, pushing PM2.5 to hazardous levels across Albuquerque, Silver City, and rural communities for extended stretches. A MERV 11 filter is the recommended baseline for most New Mexico homes, and upgrading to MERV 13 is advised during any active fire event or AQI above 100. Shop MERV Filters →
1. Alaska
State · Land area: 571,951 sq mi
Primary Pollutant
PM2.5
wildfire smoke
Total Acres Burned
1,680,000
2025 season (2× 10-yr avg)
Total Number of Fires
458+
2025 season
Burned as % of Land Area
0.46%
of 571,951 sq mi
Human-Caused Acres
11,843
43% of fires human-caused
Top Human Causes
Debris burning, outdoor recreation, campfires
Air quality note
Alaska's 2025 season burned approximately 1.68 million acres — roughly double the 10-year average and the most active season since 2022 — sparked by over 83,000 lightning strikes during a two-week solstice storm in June. Over 57% of fires were lightning-caused, but human-set fires near communities like Fairbanks and Nenana caused evacuations and days-long highway closures. Wildfire smoke is Alaska's dominant air quality threat, with PM2.5 from boreal forest and tundra fires blanketing interior communities for weeks at a time during active seasons. For Alaska homeowners, summer smoke events can be sudden and intense — a MERV 11 filter is the recommended baseline, and upgrading to MERV 13 is advised during any active fire event or AQI above 100. Shop MERV Filters →
TL;DR: Quick Answers About U.S. Wildfires
Which states have the most wildfires?
In 2024, Alaska burned the most acreage (3.1 million acres), followed by New Mexico (859,906 acres) and Texas (671,800 acres). California led in total number of fires with 7,884 and accounted for over 40% of all U.S. wildfire acreage.
Can wildfire smoke affect my state even without nearby fires?
Yes. Wildfire smoke carries fine PM2.5 particles that can travel thousands of miles. In 2023, Canadian wildfire smoke pushed New York City's AQI above 400—over 2,000 miles from the nearest blaze.
What air filter protects against wildfire smoke?
MERV 13 filters are the minimum recommended rating for capturing fine wildfire smoke particles (PM2.5) in residential HVAC systems. Standard MERV 8 filters are not effective against smoke.
When is wildfire season?
Peak wildfire season typically runs May through October in western states, though fires can occur year-round. The January 2025 California fires showed that devastating wildfires are no longer limited to summer months.
KEY TAKEAWAYS:
Wildfires are worsening, with California burning over 40% of the total wildfire acres in 2024, and 2025 is expected to be even more devastating.
Wildfire smoke impacts air quality nationwide, with cities far from fires, like New York, reaching hazardous air quality levels. Using HVAC systems with high-quality filters can help reduce smoke particles indoors.
Human activity causes 85% of wildfires, including campfires, powerline failures, and arson.
To protect your health, consider using MERV-rated air filters in your HVAC system, which can trap fine wildfire smoke particles, helping to keep indoor air cleaner during fire season.
Detailed Findings & Methodology
How we built the state wildfire cards — data sources, ranking logic, and known limitations.
Our Data Sources
The wildfire statistics in these cards are drawn primarily from the National Interagency Fire Center (NIFC), the federal government's central source for wildfire incident data. NIFC aggregates reporting from all federal, state, tribal, and local fire agencies, making it the most comprehensive dataset available for year-over-year wildfire analysis.
Where official 2025 state totals had been published at the time of research — including from the Arizona Department of Forestry and Fire Management (DFFM), Texas A&M Forest Service, Washington DNR, Oregon Department of Forestry, CAL FIRE, and the Alaska Interagency Coordination Center (AICC) — we used those official figures. Where 2025 annual reports were not yet finalized, we sourced the most current available data from NIFC year-to-date publications, state forestry agency updates, and verified news reporting from sources including the Alaska Beacon, Frontline Wildfire, and Wikipedia's 2025 state wildfire pages (which cite agency and NIFC data).
To calculate burned acreage as a proportion of each state's total land area, we used U.S. Census Bureau land area estimates. Air quality context and primary pollutant designations are based on EPA AirNow, American Lung Association State of the Air 2025–2026 reports, and state environmental agency data.
How We Ranked the States
States are ranked by total acres burned, the most widely used metric for measuring wildfire severity at the state level. Acres burned captures the overall scale of wildfire impact — including fires on federal, state, and private lands — more accurately than fire count alone. A state with fewer but larger fires (like Alaska) can experience far more ecological and air quality damage than a state with many small fires.
We included four additional metrics for each state to give a more complete picture:
Total Acres Burned
The primary ranking metric. Measures the total land area consumed by wildfire within the state's boundaries during the 2025 calendar year. Where official 2025 totals were unavailable, the most recent verified annual figure is shown and labeled accordingly.
Total Number of Fires
Shows how frequently wildfires ignite in a given state — an indicator of ongoing ignition risk even when individual fires remain small. High fire counts with low acreage (as in Texas's 2025 season) can signal effective early suppression; low fire counts with high acreage (as in Alaska) typically reflects remote, lightning-driven events allowed to burn under managed fire strategies.
Burned Acreage as a Proportion of Total Land Area
Puts raw acreage numbers in geographic context. For example, Idaho's 436,733 burned acres represents 0.8% of its land mass, while Alaska's 1.68 million acres represents only 0.46% — because Alaska is simply that much larger. This metric helps identify which states experienced proportionally severe fire seasons relative to their size.
Total Acres of Human-Caused Fires
Highlights how much of each state's wildfire damage is preventable. Roughly 85% of wildfire ignitions nationwide are human-caused. Some states — like Kentucky (99%) and Kansas (95%) — show near-total human causation; others — like Alaska (43% human-caused by ignition count) — are dominated by lightning, with human-caused fires accounting for a small fraction of total acreage.
Top Human Causes
Sourced from state forestry agency reports and NIFC cause-of-fire documentation. Common causes across states include debris burning, equipment sparks, unattended campfires, arson, and — notably in New Mexico — escaped prescribed burns. Causes are listed in order of prevalence where data was available.
What This Data Does (and Doesn't) Include
Some figures reflect 2022 baselines, not 2025.
Several states in this analysis — including Idaho, New Mexico, Nevada (partial), and others — had their original data sourced from the NIFC 2022 annual report. Where confirmed 2025 state totals were available, we updated the figures. Where they were not, we retained the 2022 baseline and labeled it clearly on the card. The 2025 season data was still being finalized by many state agencies at the time of publication.
Prescribed burns are generally excluded.
NIFC tracks wildfire incidents separately from planned prescribed burns. However, reporting practices vary between agencies, and some prescribed burns that escape containment — like New Mexico's 2022 Hermit's Peak/Calf Canyon Fire — may be reclassified as wildfires in the dataset.
Federal vs. state vs. private land differences matter.
The NIFC dataset includes fires across all land ownership types. States with large tracts of federal land (like Alaska, Idaho, and Montana) may show higher burned acreage partly because fires on remote public lands are often managed under "monitor and contain" strategies, whereas fires threatening private property trigger faster suppression.
Reporting timelines and year-boundary fires.
NIFC data is compiled on a calendar-year basis, but some incidents span year boundaries. Final acreage totals may be revised after agencies complete end-of-year reporting. Cards note where figures are partial-season or subject to update.
Air quality impact isn't always proportional to acreage.
A smaller fire burning near a population center or in certain vegetation types can produce worse air quality than a much larger fire in remote wilderness. The rankings here measure fire scale, not direct health impact on residents. That's why each card includes an air quality note with filter recommendations specific to each state's conditions and risk profile.
Our Commitment to Tracking Wildfire Data
Filterbuy has published this annual wildfire analysis since [year first published] because we believe homeowners deserve clear, data-driven information about the threats to their indoor air quality. Wildfires don’t just burn land—they generate smoke that can travel thousands of miles and compromise the air inside your home for days or even weeks.
As a U.S.-based air filter manufacturer, we see the real-world impact of wildfire season every year. Orders for [MERV 13 filters] spike during major smoke events, and our customer support team regularly helps families in fire-affected states choose the right filtration to protect their indoor air. That front-line experience is what drives us to keep this research current and accessible.
We update this page annually with new NIFC data, typically within the first quarter of each year once federal reporting is finalized. If you’d like to be notified when we publish updated wildfire rankings, subscribe to our newsletter for air quality alerts and HVAC tips.
Have a question about this data or our methodology? Reach out to our team at [info@filterbuy.com]. We’re always happy to talk air quality.
How to Protect Your Health During Wildfire Season
Beyond the destruction, wildfires pose a serious health risk due to smoke inhalation. Fine particulate matter (PM2.5) from wildfire smoke can cause:
Wildfire smoke contains fine particulate matter known as PM2.5—particles smaller than 2.5 micrometers in diameter, roughly 30 times thinner than a human hair. These particles are too small to see, but they’re small enough to bypass your body’s natural defenses and enter deep into the lungs, and even the bloodstream. Standard fiberglass air filters (MERV 1–4) cannot capture PM2.5. MERV 13 filters, however, are designed to trap particles in this size range, making them the recommended choice for homes in wildfire-affected areas.
Best Practices for Air Quality Protection
Step 1
Stay indoors
Reduce outdoor exposure when air quality is poor. Keep windows and doors closed during smoke events.
Step 2
Use HEPA filters
High-efficiency particulate air (HEPA) filters trap wildfire smoke particles indoors. MERV 11–13 rated filters are recommended.
Step 3
Monitor air quality
Use real-time AQI tools like AirNow.gov to stay updated on local conditions before going outside.
Step 4
Wear N95 masks
If outdoor exposure is unavoidable, N95 masks filter fine particulate matter (PM2.5) effectively from wildfire smoke.
Upgrade to MERV 13 during any AQI event above 100 or when regional fires are active. Replace filters more frequently during peak wildfire season. Shop MERV Filters →
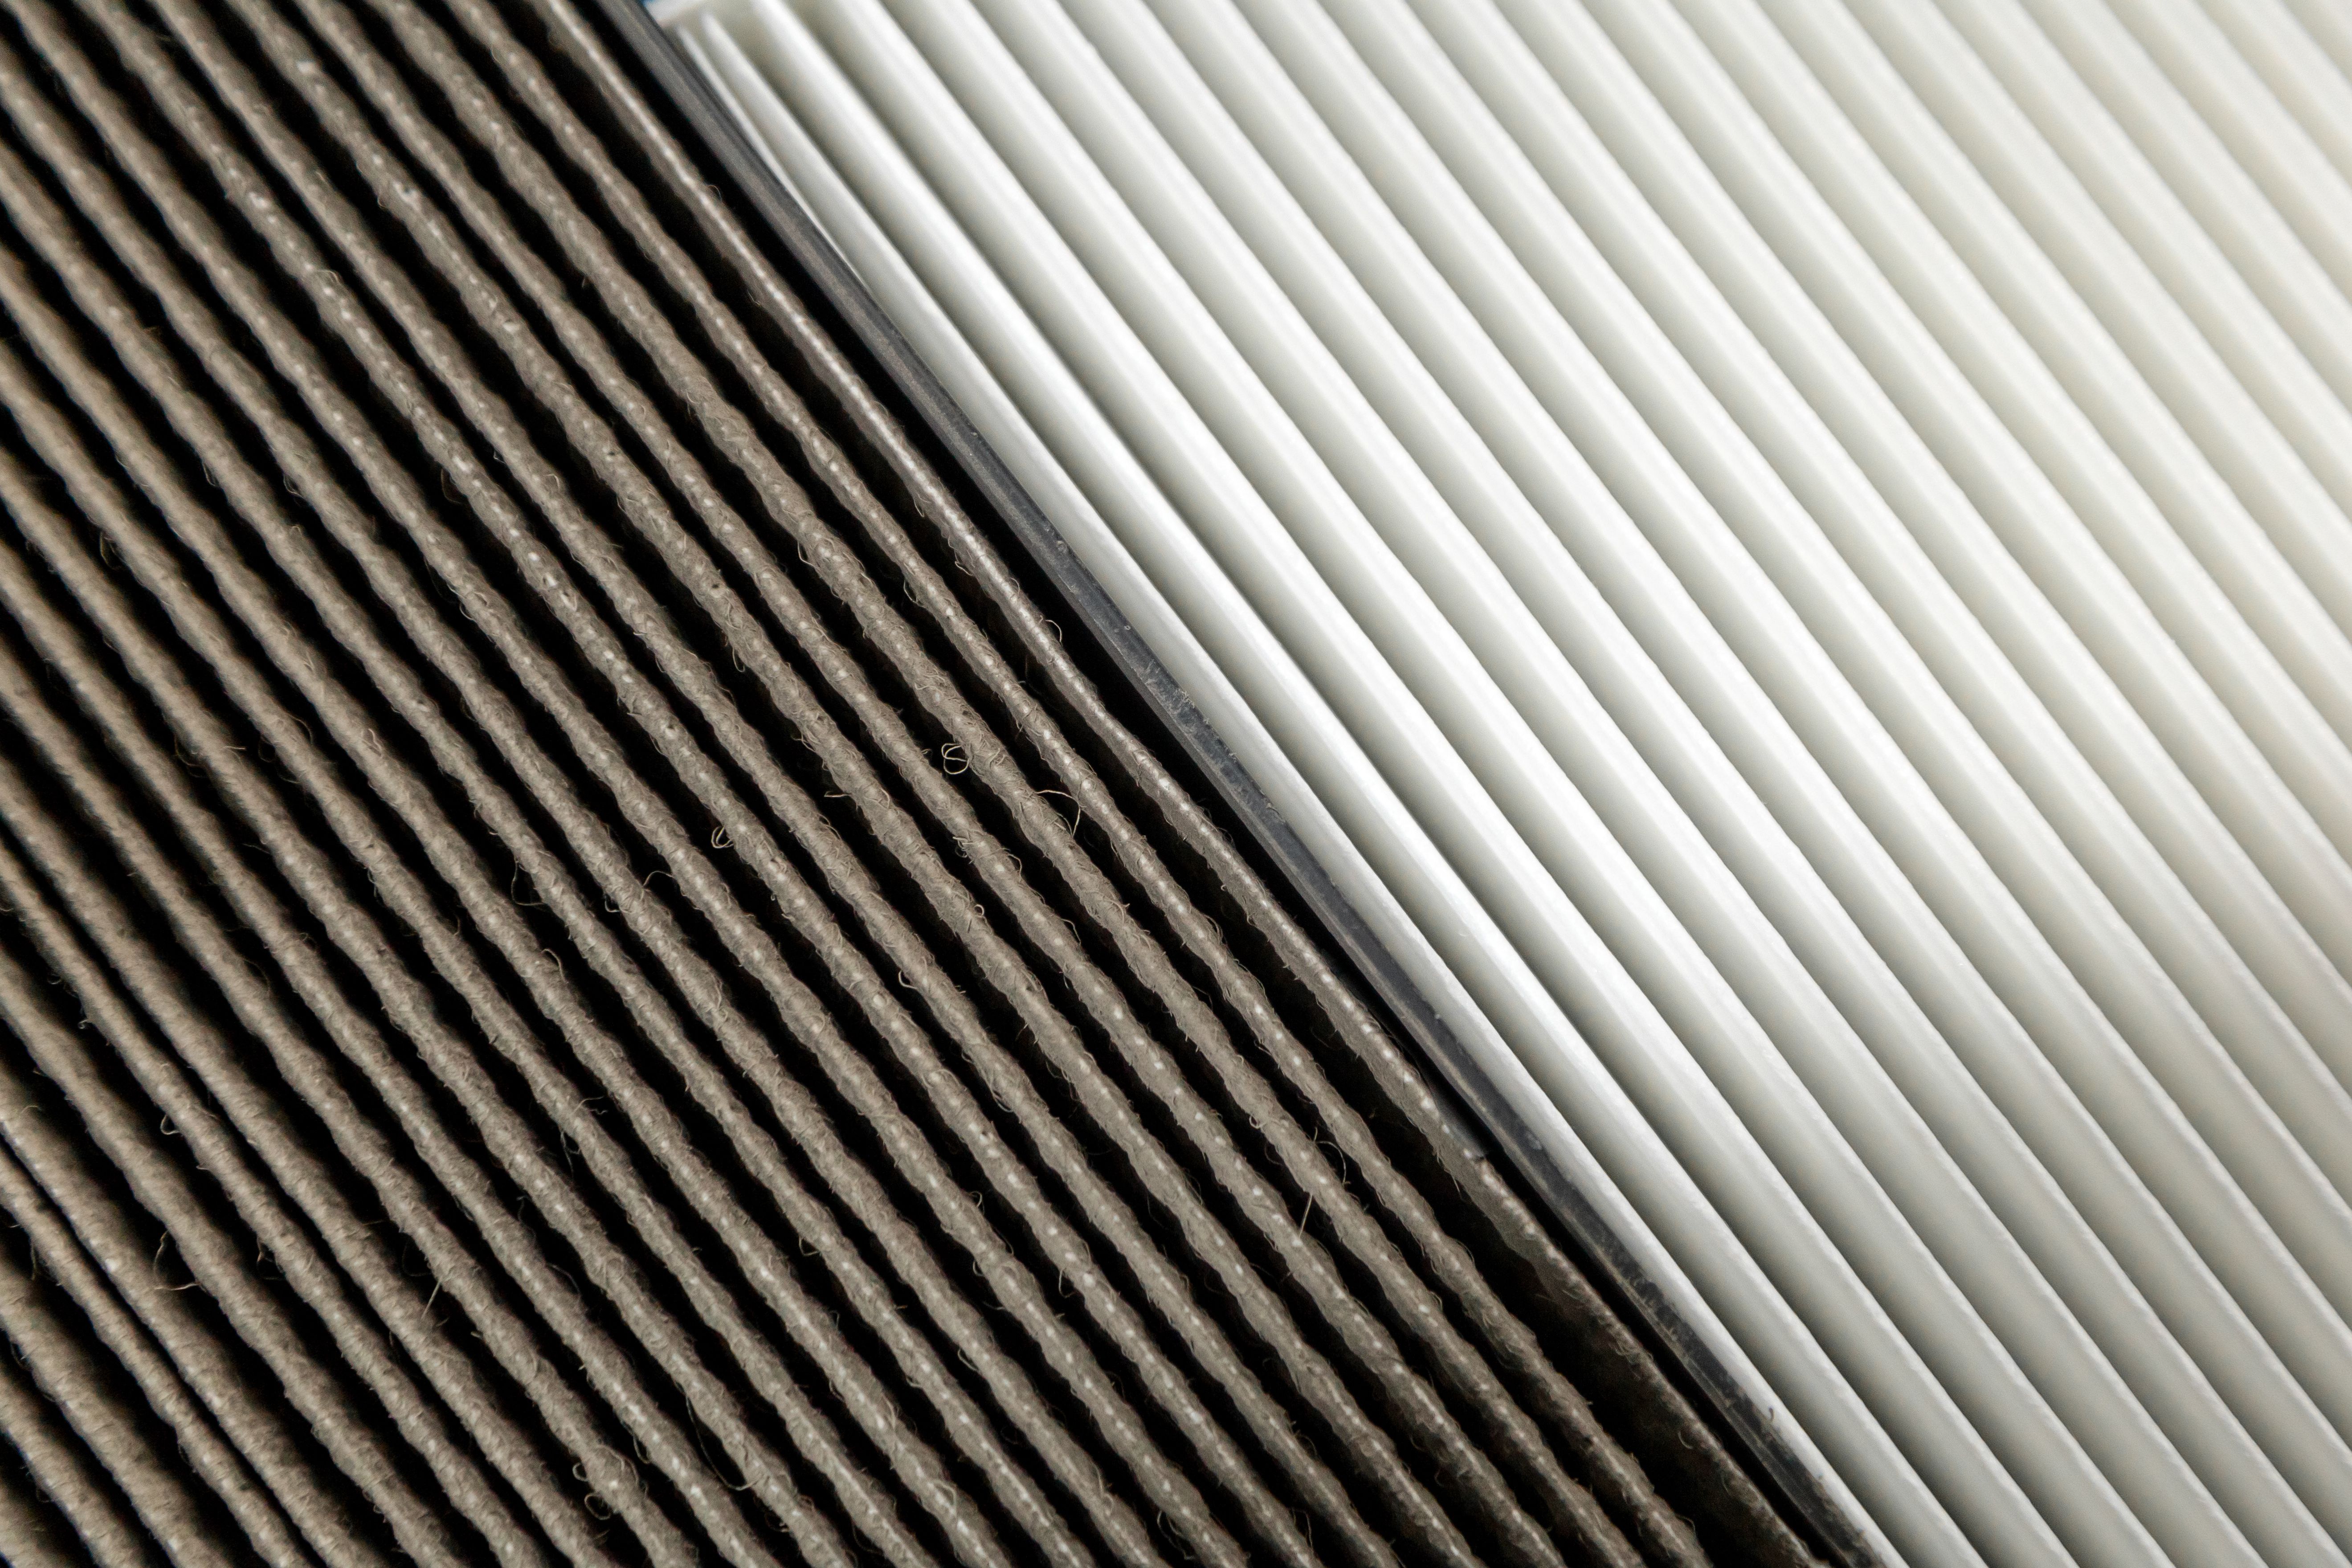
How Air Filters Reduce Fire Season Smoke Inhalation
Wildfires are becoming larger, more destructive, and more frequent due to climate change and prolonged drought conditions. With 2025 shaping up to be a severe wildfire year, preparedness is key. Stay informed, protect your health, and implement preventive measures to mitigate wildfire risks. One thing you can do is invest in high-quality replacement filters. Air filters reduce wildfire smoke inhalation by directly capturing ash and smoke particles from your indoor air.
Not all air filters are made equally, though. Only certain types of air filters can filter out wildfire smoke. Filterbuy’s MERV 13 air filters are the most effective for removing smoke from your home. MERV 13 filters can capture fine wildfire smoke particles without restricting airflow.
We manufacture our MERV 13 filters at Filterbuy facilities in Alabama, Florida, Pennsylvania, and Utah—and we’ve engineered them specifically to balance particle capture efficiency with the airflow demands of residential HVAC systems. That balance matters more than most people realize. A filter that’s too restrictive for your system can reduce airflow, strain your blower motor, and actually make your indoor air quality worse by limiting circulation. Our MERV 13 filters are built to capture particles down to 0.3 micrometers—including the fine PM2.5 that makes wildfire smoke so hazardous—while maintaining the airflow your system needs to keep running efficiently.
All HVAC systems are different, so choosing the right filter can be a challenge. The correct air filter can drastically improve indoor air quality and reduce smoke inhalation during fire season. However, the wrong air filter can break your system entirely. To help you find the perfect filter fit, take our MERV Match Quiz.
Frequently Asked Questions:
What MERV rating do I need for wildfire smoke?
For wildfire smoke, a MERV 13 filter is the minimum recommended rating for residential HVAC systems. MERV 13 filters capture particles as small as 0.3 micrometers, including the fine PM2.5 particles that make wildfire smoke particularly dangerous. Standard MERV 8 filters are not effective against smoke. If your HVAC system can accommodate it, MERV 13 provides the best balance of particle capture and airflow for most home systems
Can wildfire smoke from another state affect my air quality?
Yes. Wildfire smoke can travel thousands of miles on atmospheric wind patterns. In 2023, smoke from Canadian wildfires pushed air quality in New York City to hazardous levels—over 2,000 miles from the nearest fire. Residents in the Midwest, Northeast, and Southeast can all be affected by distant wildfires during peak fire season, making indoor air filtration important even in states that don’t experience fires directly.
How do I know if wildfire smoke is affecting my area?
Check the Air Quality Index (AQI) for your area using AirNow.gov or Filterbuy’s live AQI map. Visible signs include hazy or discolored skies, a smoky smell outdoors, and reduced visibility. If your AQI rises above 100, take steps to protect your indoor air by running your HVAC system with a MERV 13 filter and keeping windows and doors closed.
Should I run my HVAC system during a wildfire smoke event?
Yes, but with the right setup. Run your HVAC system with a MERV 13 filter and set it to recirculate mode rather than drawing in fresh outdoor air. This continuously filters your indoor air without pulling smoky air inside. If your system has a fresh air intake, close it during smoke events. Avoid running exhaust fans or opening windows, as these create negative pressure that pulls smoke indoors.
What causes wildfires?
Wildfires are primarily caused by human activities (85%), such as unattended campfires, powerline malfunctions, and arson. Lightning also contributes but is less frequent.
How are wildfires affecting air quality?
Wildfire smoke carries fine particles that can travel thousands of miles, leading to hazardous air quality in areas far from the fire zones. Cities like New York have experienced AQI levels over 400, posing serious health risks.
What is AQI, and why is it important during wildfire season?
The Air Quality Index (AQI) measures the concentration of pollutants in the air, such as smoke particles. An AQI over 150 is considered unhealthy, and anything above 300 is hazardous.
How can I protect my indoor air quality during wildfire season?
Using high-efficiency air filters in your HVAC system, such as MERV 13-rated filters, can help trap smoke particles and improve indoor air quality during fire season.
What is MERV, and why is it important for wildfire smoke?
MERV (Minimum Efficiency Reporting Value) measures how effectively an air filter traps particles. A MERV 13 filter is ideal for capturing fine wildfire smoke particles without compromising airflow.
How often should I replace my HVAC air filters during wildfire season?
It’s recommended to change your air filters every 1-3 months during wildfire season, especially if your area is experiencing heavy smoke. Frequent replacements ensure your HVAC system runs efficiently and helps maintain air quality.
Can air filters prevent all harmful particles from wildfires?
Air filters are made to capture particles. But, MERV 13 filters are best at effectively reducing smoke particles, improving indoor air quality and reducing health risks.
How does wildfire smoke affect health?
Children, older adults, pregnant women, and people with asthma, COPD, or heart conditions face elevated risk from wildfire smoke exposure. Children breathe more air per pound of body weight than adults, making them especially vulnerable to PM2.5 inhalation. If your household includes anyone in these groups, prioritize MERV 13 filtration, keep windows sealed during smoke events, and check your local AQI daily using tools like AirNow.gov.
Are there any other ways to protect myself from wildfire smoke indoors?
In addition to using air filters, consider sealing windows and doors to prevent smoke from entering, staying indoors when air quality is poor, and using N95 masks if you must go outside.
Why is California more affected by wildfires than other states?
California experiences more frequent wildfires due to its dry climate, high winds, and long periods of drought. Additionally, 40% of all burned acres in the U.S. occurred in California in 2024, making it the state most at risk.
How does climate change affect wildfires?
Climate change contributes to higher temperatures and prolonged droughts, creating ideal conditions for wildfires to ignite and spread. These changes have led to longer, more intense fire seasons each year.
How can I prepare my home for wildfire season?
Prepare by creating defensible space around your property, using fire-resistant materials, installing high-efficiency air filters in your HVAC system, and staying informed about local fire risks and air quality reports.
✅
Filterbuy
Wildfire season indoor air quality checklist
Upgrade HVAC filters to MERV 13 before fire season begins
Typically May–June in western states. Don't wait for smoke — get ahead of it.
Before season
Stock replacement filters
Plan to change them monthly during active smoke events — filters load faster than usual under heavy smoke conditions.
Before season
Seal gaps around windows and doors
Use weatherstripping to prevent smoke infiltration. Even small gaps allow fine PM2.5 particles to enter.
Prepare home
Set HVAC to recirculate mode during smoke events
Switch off fresh air intake — recirculate mode keeps the system filtering indoor air instead of pulling in outdoor smoke.
Prepare home
Bookmark your local AQI monitoring page
Check AirNow.gov daily during fire season. Set up alerts for AQI above 100 in your zip code.
Stay informed
Keep N95 masks accessible for outdoor trips
Store a supply near your door for days when air quality is poor but outdoor activity can't be avoided. N95s filter PM2.5 effectively.
Stay informed
⭐
Set up Filterbuy auto-delivery
Ensure fresh filters arrive on schedule — no running out during peak smoke season when you need protection most.
Shop now →
Protect Your Home's Air Before the Next Wildfire Season Hits
If your state made this list, your indoor air quality is at risk during fire season—and a standard filter won't cut it. Shop Filterbuy MERV 13 filters to start capturing the fine smoke particles that matter most, shipped free and factory-direct to your door.
