July 23, 2026

By David Heacock
The emission of carbon dioxide has long been recognized as the leading driver of global climate change. Since the Industrial Revolution began in the mid-1800s, the global economy has largely been powered by heavily carbon-emitting fuel sources like oil, coal, and gas. While this has brought tremendous wealth and prosperity, CO2 emissions have grown exponentially, contributing to an enhanced greenhouse gas effect that traps heat in the atmosphere.
The world is now grappling with the long-term ramifications of climate change, including extreme weather events, changes to water resources and agriculture, and newfound health challenges. Many governments are mobilizing to limit the effects of climate change and reduce carbon output as quickly as they can.
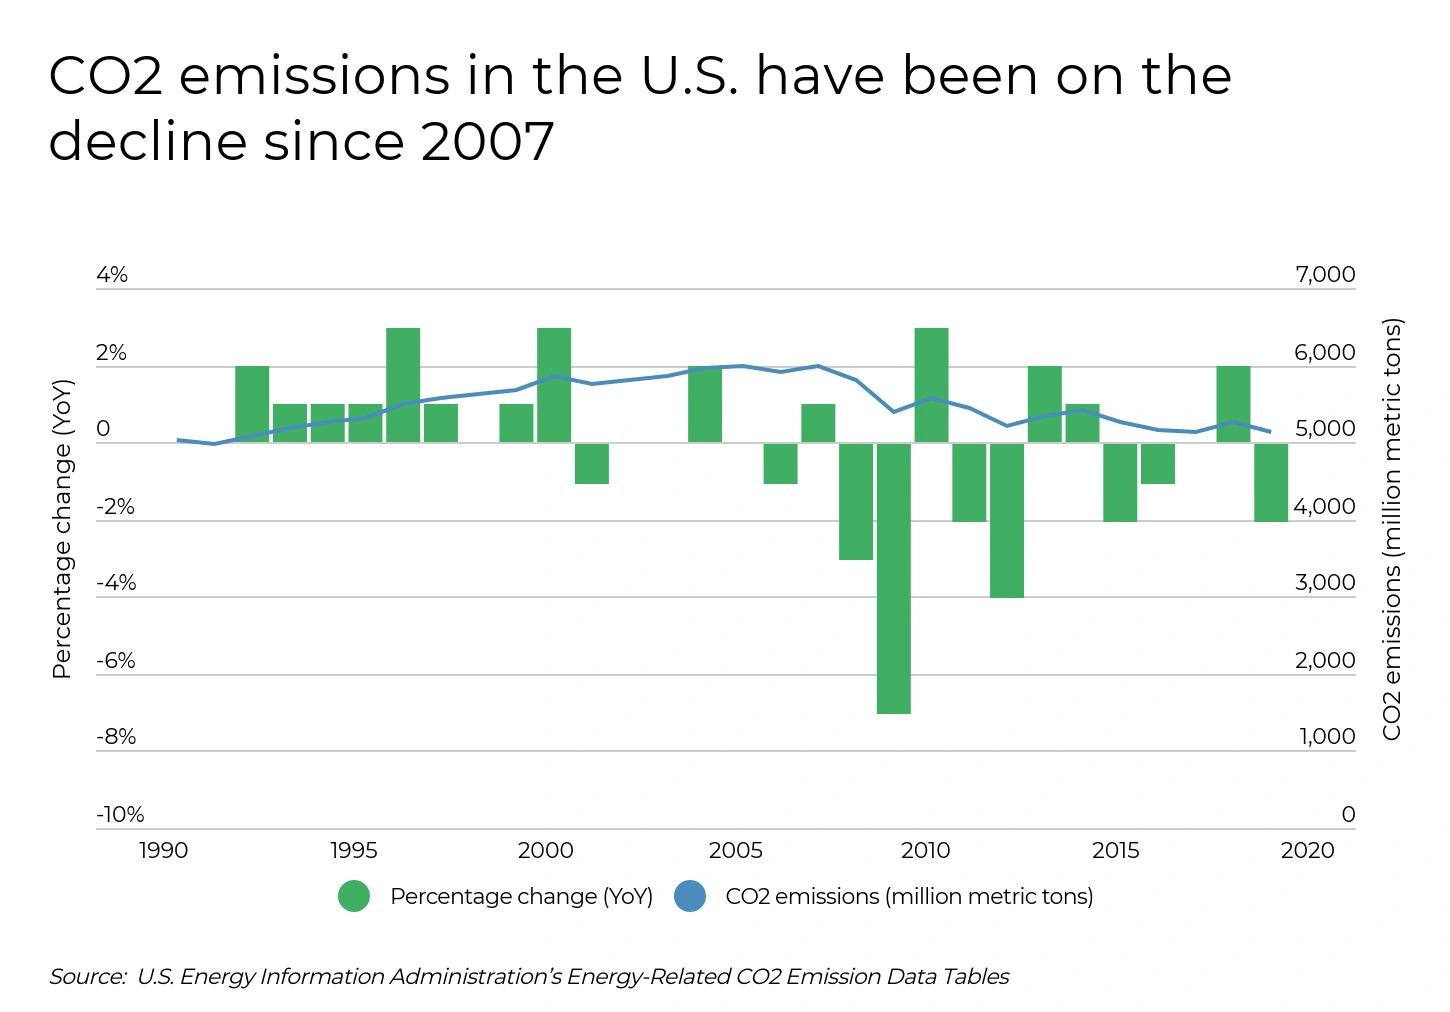
And on that front, while there is much more that can be done to lower carbon emissions in the U.S., data from the last three decades shows that America has begun trending in the right direction.
The turning point came in 2007, and the economic recession may have been the reason why. When the economy began to slow in 2007, it initially meant less industrial activity and less use of transportation, which reduced carbon emissions in those sectors. The government stimulus package passed in 2009 provided a number of incentives for development and adoption of renewable technologies, so as the economy came back, cleaner fuel sources were powering the recovery. The result is that total carbon dioxide emissions are down 14.5% overall compared to 2007.
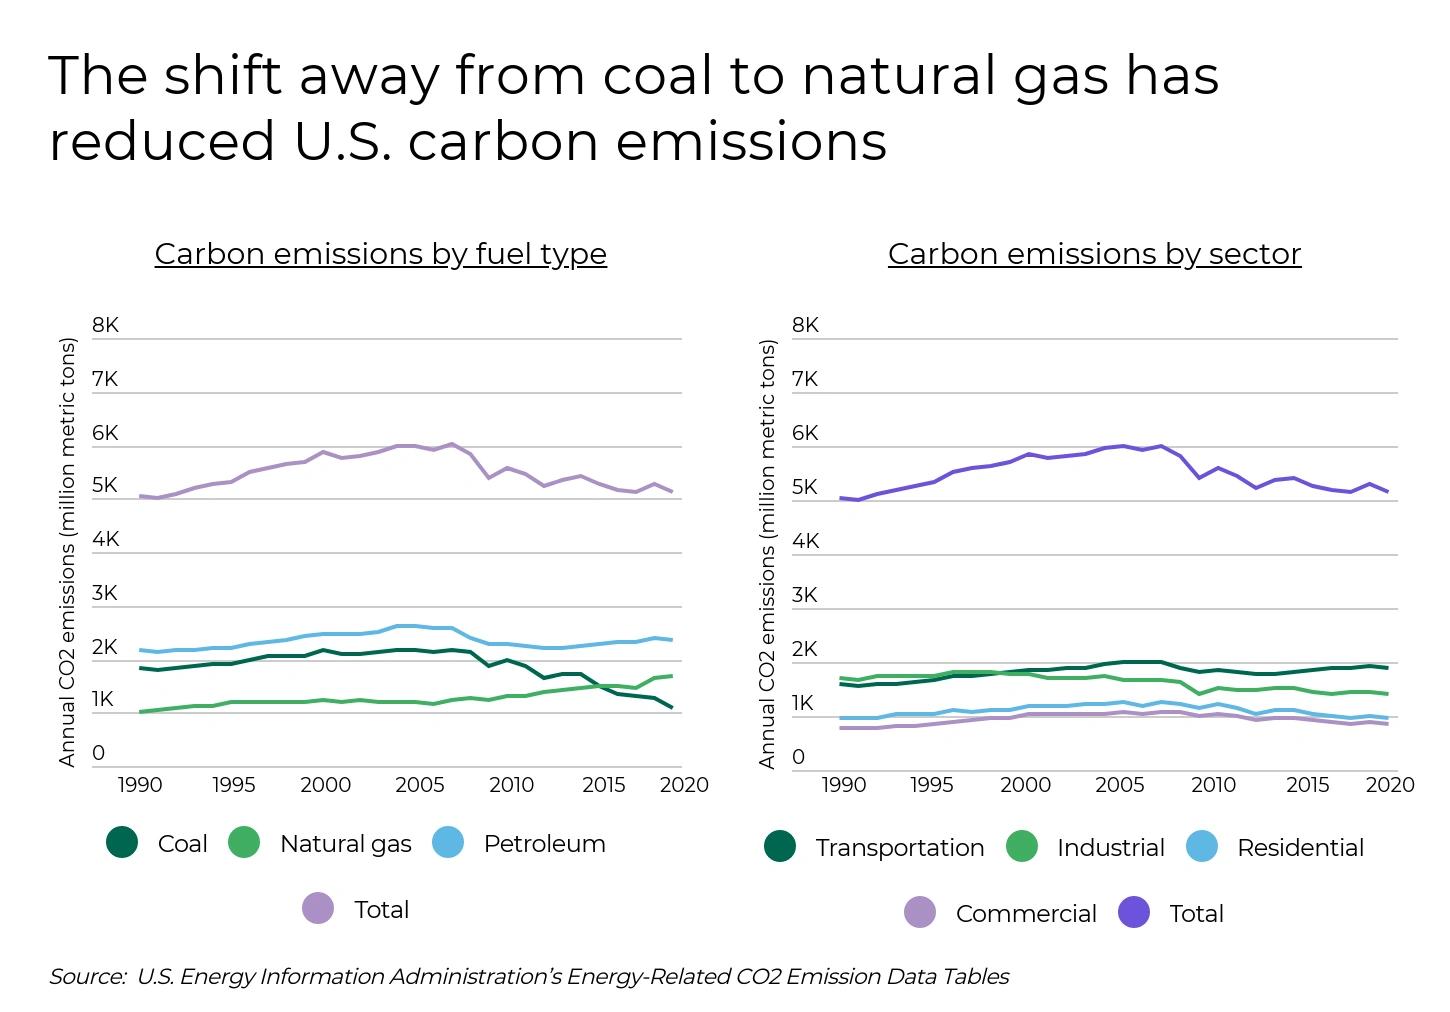
These factors have been demonstrated most strongly in the turn away from coal as a major fuel source over the last 15 years. Coal is one of the most carbon-heavy fuel sources, but coal’s overall CO2 emissions output in the U.S. in 2019 was less than half of what it was in 2005. Over that span, cleaner alternatives simultaneously became less expensive: the widespread adoption of fracking has made the cost of extracting natural gas lower, while advances in renewable sources like solar and wind have allowed those technologies to build scale.
The same transition to cleaner fuels can be seen across sectors, albeit more gradually. Industrial emissions have been trending downward for the longest period of time, perhaps due to long-running government efforts to regulate industrial source pollution of all types, and in 2019, emissions in the sector were down around 18% from their levels fifteen years prior. In transportation, which is still dominated by petroleum-based fuel sources, emissions in 2019 were nonetheless down 5.5% from the 2007 peak of more than 2,000 million metric tons of CO2 emitted annually. Residential and commercial emissions fared best, dropping more than 20% each from their respective mid-2000s peaks.
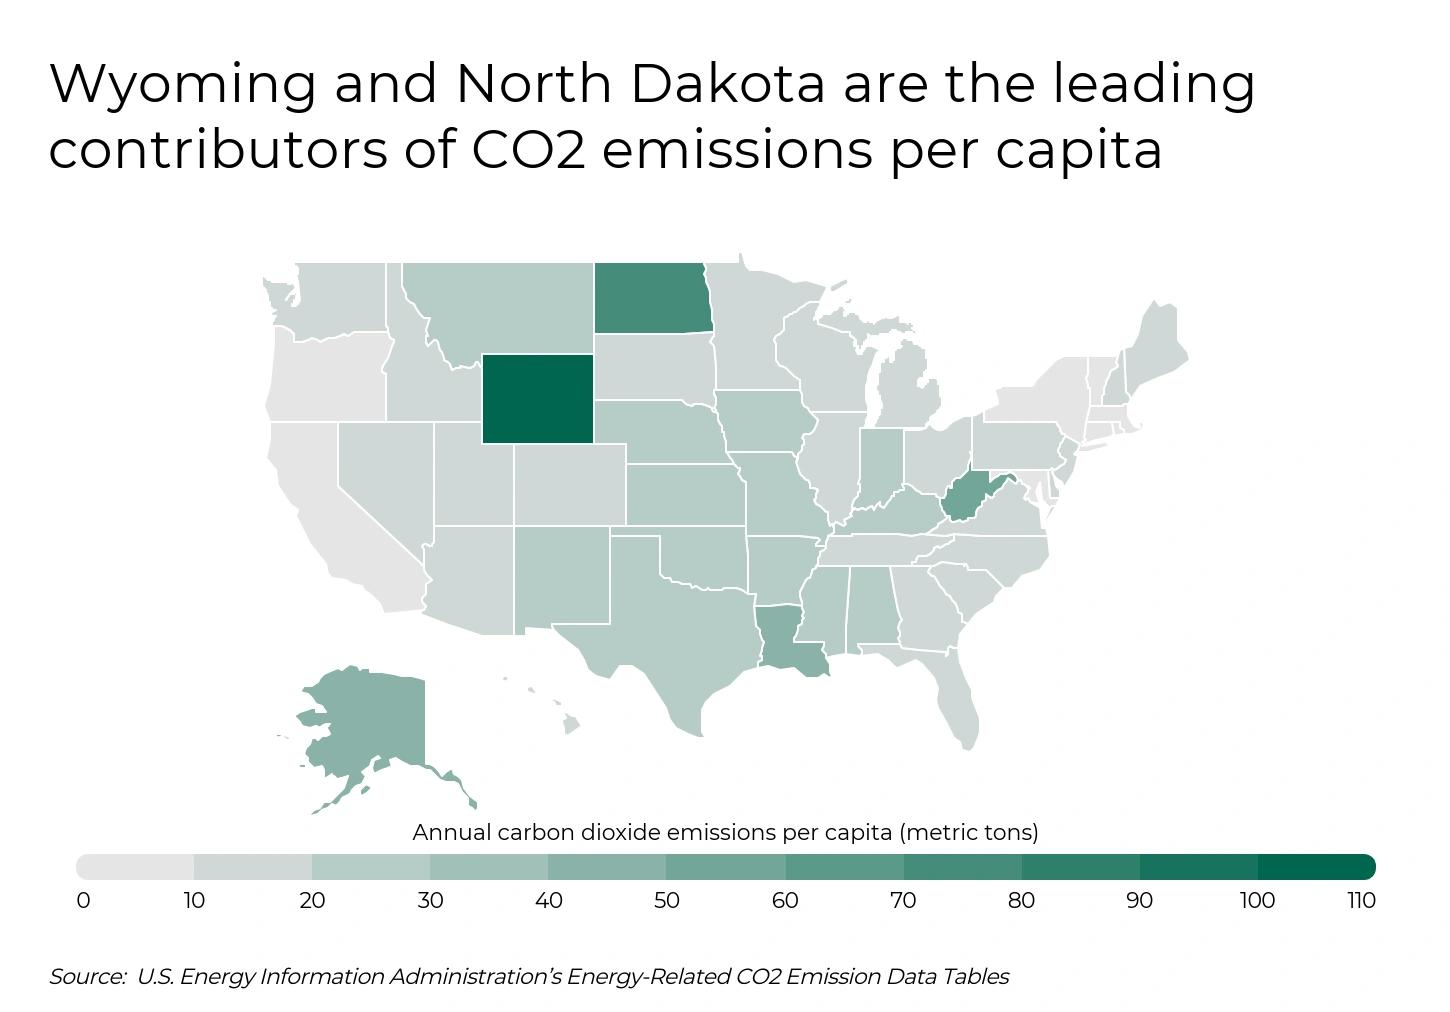
Of course, not every state is lowering its carbon dioxide emissions at the same rate. Our look at the states with the highest levels of carbon emissions on a per capita basis finds that the leading states have two factors in common: a low population density and economies dependent on production of carbon-emitting fuels extracted in that state. The top state for carbon output per capita is Wyoming, which produces nearly 39% of the nation’s coal and is second-lowest in population density. Runner-up North Dakota is fourth-lowest in population density and, in addition to having a large supply of coal, is one of the states that benefited most from the fracking boom for natural gas production. And other states in the top five are also closely linked with carbon-based fuel production: West Virginia (coal and natural gas), Louisiana (crude oil and natural gas), and Alaska (crude oil and natural gas).
At the other end of the spectrum, states with dense populations and those who have adopted government policy or industry incentives to promote clean fuel sources have lower emissions per capita. Density helps with reducing carbon emissions by reducing commute times in urban areas, providing scale for more shared transportation options, and promoting other carbon efficiencies, while clean fuel sources naturally make states less reliable on carbon-intensive fuels. For these reasons, the states with the lowest emissions are led by dense population centers like New York and green energy leaders like Vermont.
DID YOU KNOW? You can be sure that the air in your home is clean and healthy to breathe when you replace your home air filters regularly. For the best protection, consider Filterbuy’s MERV 13 air filters.
To find these locations, researchers at Filterbuy used data from the U.S. Energy Information Administration and the U.S. Census Bureau to rank states on carbon emissions per capita. Our team also collected data on total carbon emissions, the fuel source and sector with the most carbon emissions, and the population density for each state.
Here are the states with the highest (and lowest) carbon emissions per person.
Photo Credit: Alamy Stock Photo
Annual carbon dioxide emissions per capita: 105.4 metric tons
Total annual carbon dioxide emissions: 61.0 million metric tons
Fuel source with the most carbon dioxide emissions: Coal
Sector with the most carbon emissions: Electric Power
Population density: 6.0 people per square mile
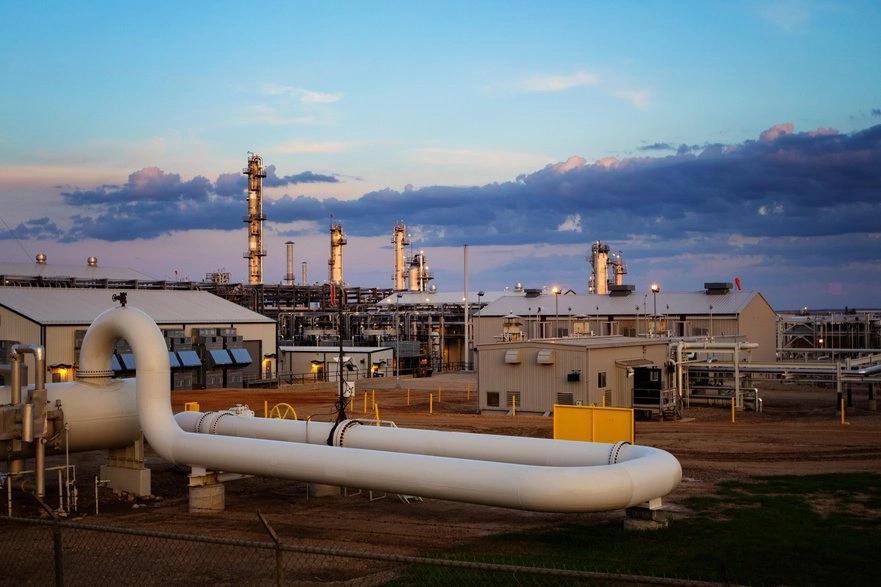
Photo Credit: Alamy Stock Photo
Annual carbon dioxide emissions per capita: 74.9 metric tons
Total annual carbon dioxide emissions: 56.5 million metric tons
Fuel source with the most carbon dioxide emissions: Coal
Sector with the most carbon emissions: Electric Power
Population density: 11.0 people per square mile
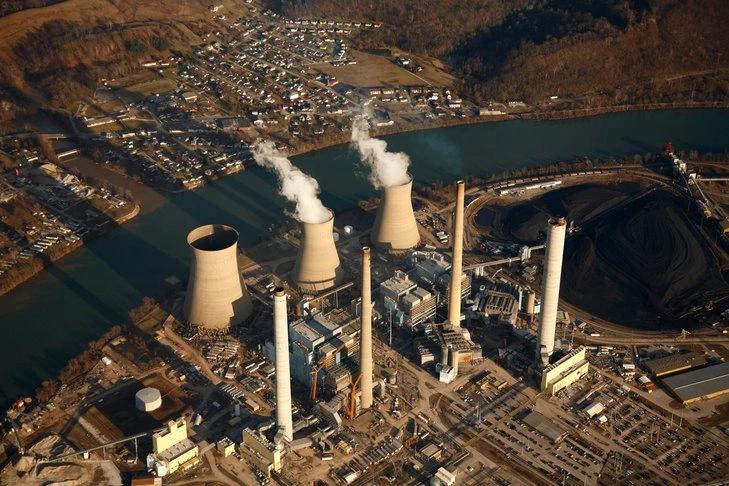
Photo Credit: Alamy Stock Photo
Annual carbon dioxide emissions per capita: 50.3 metric tons
Total annual carbon dioxide emissions: 91.3 million metric tons
Fuel source with the most carbon dioxide emissions: Coal
Sector with the most carbon emissions: Electric Power
Population density: 74.6 people per square mile
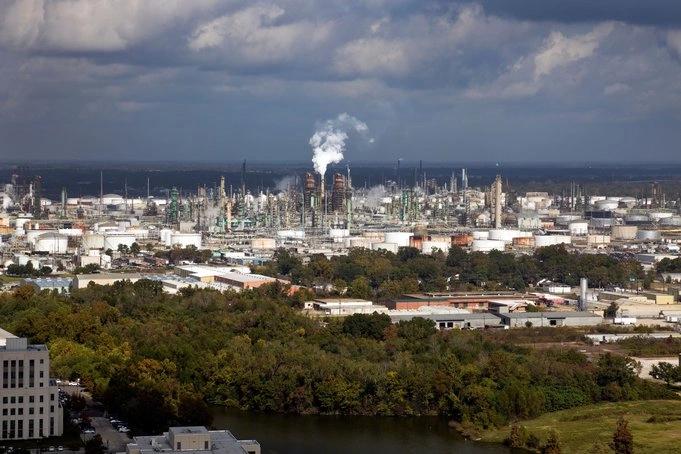
Photo Credit: Alamy Stock Photo
Annual carbon dioxide emissions per capita: 48.8 metric tons
Total annual carbon dioxide emissions: 227.9 million metric tons
Fuel source with the most carbon dioxide emissions: Petroleum
Sector with the most carbon emissions: Industrial
Population density: 107.6 people per square mile

Photo Credit: Alamy Stock Photo
Annual carbon dioxide emissions per capita: 46.3 metric tons
Total annual carbon dioxide emissions: 34.3 million metric tons
Fuel source with the most carbon dioxide emissions: Natural Gas
Sector with the most carbon emissions: Industrial
Population density: 1.3 people per square mile

Photo Credit: Alamy Stock Photo
Annual carbon dioxide emissions per capita: 28.9 metric tons
Total annual carbon dioxide emissions: 30.5 million metric tons
Fuel source with the most carbon dioxide emissions: Coal
Sector with the most carbon emissions: Electric Power
Population density: 7.3 people per square mile

Photo Credit: Alamy Stock Photo
Annual carbon dioxide emissions per capita: 26.6 metric tons
Total annual carbon dioxide emissions: 177.0 million metric tons
Fuel source with the most carbon dioxide emissions: Coal
Sector with the most carbon emissions: Electric Power
Population density: 187.9 people per square mile

Photo Credit: Alamy Stock Photo
Annual carbon dioxide emissions per capita: 25.7 metric tons
Total annual carbon dioxide emissions: 114.3 million metric tons
Fuel source with the most carbon dioxide emissions: Coal
Sector with the most carbon emissions: Electric Power
Population density: 113.1 people per square mile
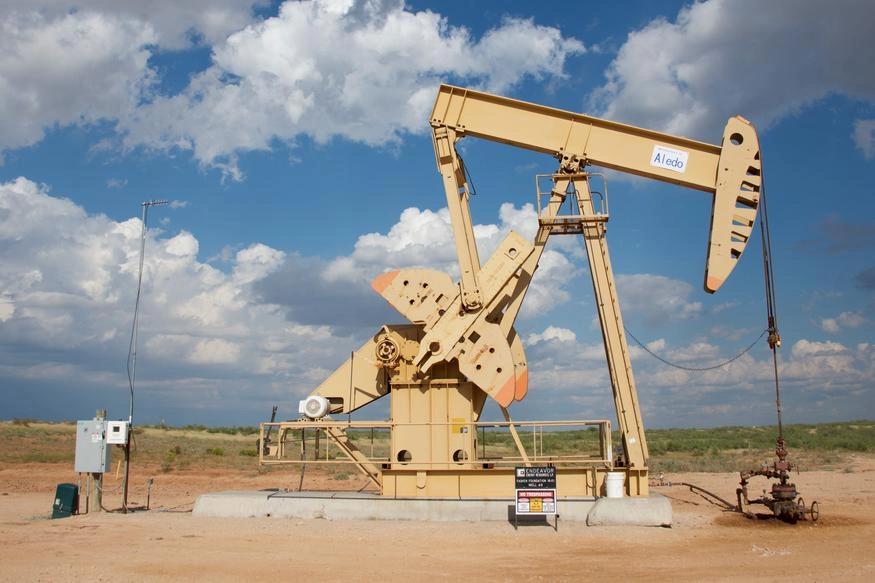
Photo Credit: Alamy Stock Photo
Annual carbon dioxide emissions per capita: 25.1 metric tons
Total annual carbon dioxide emissions: 711.0 million metric tons
Fuel source with the most carbon dioxide emissions: Petroleum
Sector with the most carbon emissions: Industrial
Population density: 111.0 people per square mile

Photo Credit: Alamy Stock Photo
Annual carbon dioxide emissions per capita: 25.0 metric tons
Total annual carbon dioxide emissions: 48.0 million metric tons
Fuel source with the most carbon dioxide emissions: Coal
Sector with the most carbon emissions: Electric Power
Population density: 25.2 people per square mile

Photo Credit: Alamy Stock Photo
Annual carbon dioxide emissions per capita: 8.1 metric tons
Total annual carbon dioxide emissions: 157.7 million metric tons
Fuel source with the most carbon dioxide emissions: Petroleum
Sector with the most carbon emissions: Transportation
Population density: 412.8 people per square mile

Photo Credit: Alamy Stock Photo
Annual carbon dioxide emissions per capita: 8.6 metric tons
Total annual carbon dioxide emissions: 52.0 million metric tons
Fuel source with the most carbon dioxide emissions: Petroleum
Sector with the most carbon emissions: Transportation
Population density: 622.8 people per square mile
Photo Credit: Alamy Stock Photo
Annual carbon dioxide emissions per capita: 9.2 metric tons
Total annual carbon dioxide emissions: 360.9 million metric tons
Fuel source with the most carbon dioxide emissions: Petroleum
Sector with the most carbon emissions: Transportation
Population density: 253.6 people per square mile

Photo Credit: Alamy Stock Photo
Annual carbon dioxide emissions per capita: 9.3 metric tons
Total annual carbon dioxide emissions: 5.8 million metric tons
Fuel source with the most carbon dioxide emissions: Petroleum
Sector with the most carbon emissions: Transportation
Population density: 67.7 people per square mile

Photo Credit: Alamy Stock Photo
Annual carbon dioxide emissions per capita: 9.3 metric tons
Total annual carbon dioxide emissions: 38.6 million metric tons
Fuel source with the most carbon dioxide emissions: Petroleum
Sector with the most carbon emissions: Transportation
Population density: 43.9 people per square mile

Photo Credit: Alamy Stock Photo
Annual carbon dioxide emissions per capita: 9.3 metric tons
Total annual carbon dioxide emissions: 63.7 million metric tons
Fuel source with the most carbon dioxide emissions: Petroleum
Sector with the most carbon emissions: Transportation
Population density: 883.7 people per square mile

Photo Credit: Alamy Stock Photo
Annual carbon dioxide emissions per capita: 9.4 metric tons
Total annual carbon dioxide emissions: 33.6 million metric tons
Fuel source with the most carbon dioxide emissions: Petroleum
Sector with the most carbon emissions: Transportation
Population density: 736.3 people per square mile

Photo Credit: Alamy Stock Photo
Annual carbon dioxide emissions per capita: 9.5 metric tons
Total annual carbon dioxide emissions: 10.1 million metric tons
Fuel source with the most carbon dioxide emissions: Petroleum & Natural Gas
Sector with the most carbon emissions: Transportation
Population density: 1,024.5 people per square mile

Photo Credit: Alamy Stock Photo
Annual carbon dioxide emissions per capita: 10.0 metric tons
Total annual carbon dioxide emissions: 13.5 million metric tons
Fuel source with the most carbon dioxide emissions: Petroleum
Sector with the most carbon emissions: Transportation
Population density: 151.9 people per square mile

Photo Credit: Alamy Stock Photo
Annual carbon dioxide emissions per capita: 10.6 metric tons
Total annual carbon dioxide emissions: 78.7 million metric tons
Fuel source with the most carbon dioxide emissions: Petroleum
Sector with the most carbon emissions: Transportation
Population density: 114.6 people per square mile
The data used in this analysis is from the U.S. Energy Information Administration’s Energy-Related CO2 Emission Data Tables and the U.S. Census Bureau’s 2019 American Community Survey. The emissions data utilized for rankings is from the year 2017, the most recent data available. To determine the states with the highest carbon emissions, researchers ranked states based on the annual carbon dioxide emissions per capita. In the event of a tie, the state with the greater total annual carbon dioxide emissions was ranked higher. Annual carbon dioxide emissions per capita is displayed in “metric tons of energy-related carbon dioxide per person.” Total annual carbon dioxide emissions are displayed in “million metric tons of energy-related carbon dioxide.” Population density was calculated as the state population divided by its land area in square miles.