Shop by

By David Heacock, CEO of Filterbuy
The story of American history is inextricably intertwined with the story of urbanization. At its founding, the U.S. was a predominantly agrarian, rural society, with only about one in 20 residents living in urban areas. The onset of the Industrial Revolution in the early- to mid-1800s sparked rapid urbanization as more people left the farms for industrial jobs in growing cities. As urban areas continued to grow, the post-World War II era also led to heavy growth in suburban areas, with a population boom driven by new births and a building boom driven by mass production techniques that lowered the cost of homeownership. In recent years, trends have pointed toward re-urbanization, with more people leaving the suburbs to return to cities, attracted by the amenities and economic opportunities available in urban centers.

Today, the split of urban and rural Americans looks almost inverted compared to the population distribution of more than two centuries ago. In 2010, the share of Americans living in urban areas surpassed 80 percent for the first time. With increasingly divergent economic prospects in urban and rural America, there is good reason to believe that the trend toward city living could continue. While many rural areas stagnate or decline, urban areas continue to attract jobs and capital investment.
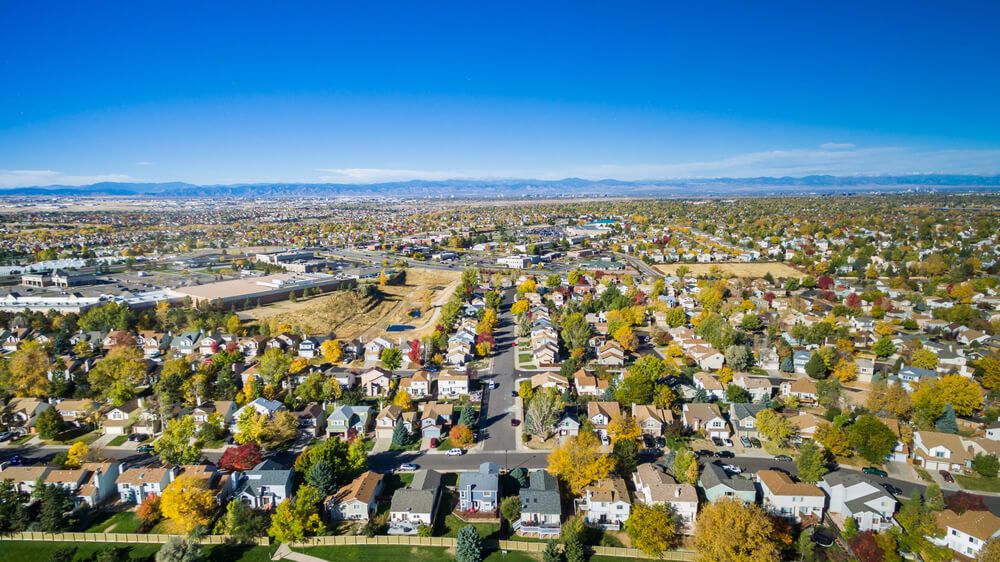
One question now, however, is whether COVID-19 will slow down or reverse that pattern. The hustle and bustle that gives large, densely-populated cities their character—with large numbers of people from many different places constantly crossing paths and crowding together—also creates the conditions for widespread transmission of viruses like COVID-19. Indeed, some of the worst-hit areas in the pandemic have been dense urban centers, including America’s two largest metros: New York and Los Angeles. As a result, there are some early indications that urbanites are showing a greater preference for low-density living with more outdoor space. But as the fall surge of coronavirus cases in the upper Midwest has shown, even rural communities are not invulnerable from viral spread, and it remains to be seen whether these shifts in living preferences will prove durable even after vaccines are widely available, and the threat of COVID-19 subsides.

For now, urbanization remains the dominant characteristic in many parts of the country outside of New England, the Midwest, and parts of the South. In fact, nine states have more than 90 percent of their population living in urban areas, led by California at 95 percent. Across the country, only four states—Mississippi, West Virginia, Vermont, and Maine—have less than half of their population in urban areas.
RELATED
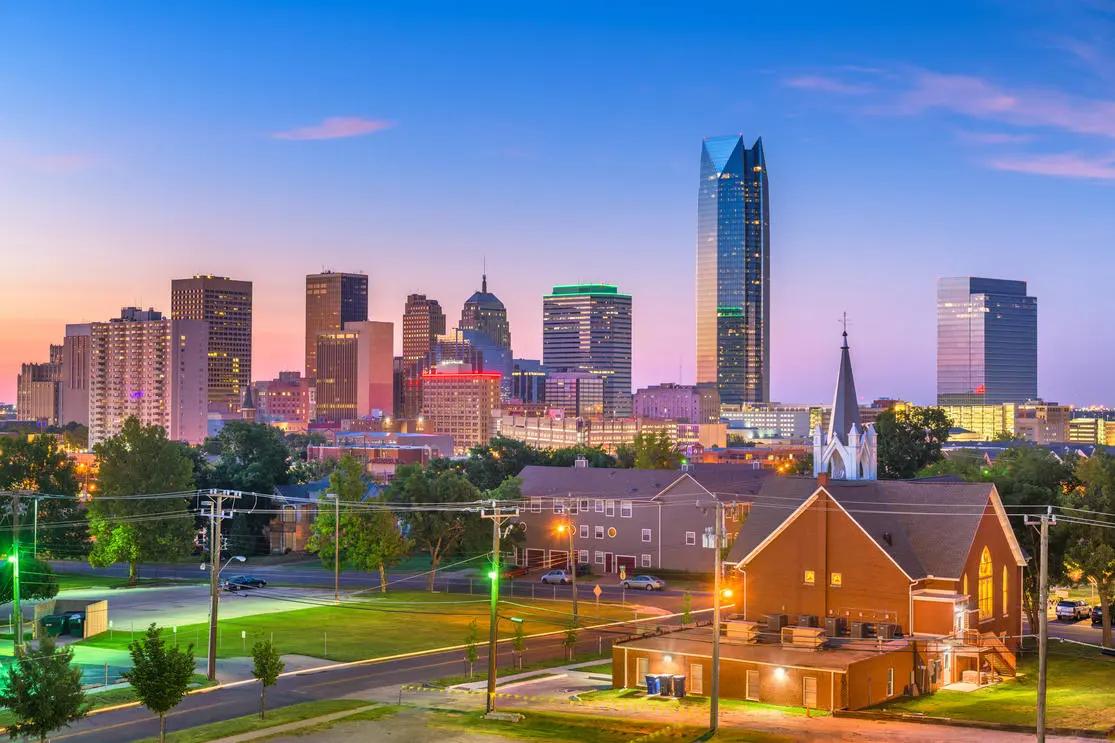
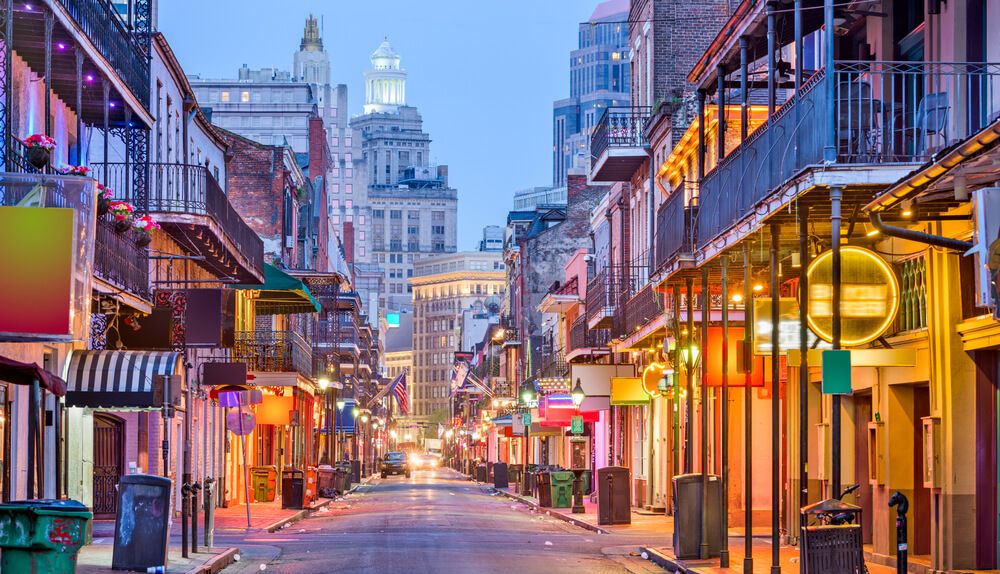
Residents of densely populated cities often endure generally worse air quality composed of many unhealthy pollutants. If you live in an urban area, it’s important to replace your home air filters frequently.


In terms of overall population density, states in the Mid-Atlantic and New England regions lead the nation, with New Jersey topping the list at more than 1,200 residents per square mile. Cities in these long-established states—including Rhode Island, Massachusetts, Connecticut, and Maryland—were the original beneficiaries of the population growth following the Industrial Revolution, and their populations remain densely clustered in urban centers. Sun Belt states like Arizona, Florida, Nevada, Texas, and the Carolinas could be poised to move up the list as migration-driven population growth continues in these areas.
As with states, population density in cities depends both on the number of residents and land area. San Francisco, CA and Jacksonville, FL have similar populations at around 900,000 each, but the differences in land area—46.9 square miles for San Francisco versus 747.3 square miles in Jacksonville—make them the second-most and second-least densely populated large city in the U.S., respectively.
To find which cities have the highest and lowest population density, researchers at Filterbuy collected population and land area figures for every U.S. city with a population above 100,000 to calculate the population density per square mile. The researchers also pulled population data from 2010 to show how density has changed in these cities over the last decade.
Here are the most and least densely populated cities in America.


Population statistics are from the U.S. Census Bureau American Community Survey 1-Year Estimates. Land areas for each city are from the U.S. Census Bureau’s TIGERweb data.
To identify the most and least densely populated locations, researchers divided the total 2019 population by the 2019 land area in square miles. Researchers also calculated the percentage change in population density comparing 2019 population and land area to 2010 population and land area. In most cases, changes in population density were the result of changes in population between the two time periods; however, the land area of certain locations also changed significantly since 2010.
Only cities with at least 100,000 people in 2019 were included in the analysis. Additionally, cities were grouped into cohorts based on population: small (100,000–149,999), midsize (150,000–349,999), and large (350,000 or more).
