
Austin Real-Time AQI Tracker


Get Alerts For Unhealthy AQI In Your Area
When air quality in your area reaches unhealthy levels, we'll send you a quick alert, along with expert tips on how to reduce your exposure.
What's Actually In Austin Air Today?
What High AQI Means for Your Lungs in Austin
How to Read AQI
The Air Quality Index (AQI) measures how polluted the air is and how it may affect your health.
0–50 (Good): Air quality is satisfactory.
51–100 (Moderate): Acceptable, but some pollutants may pose minor concerns.
101–150 (Unhealthy for Sensitive Groups)
151–200 (Unhealthy)
201–300 (Very Unhealthy)
301+ (Hazardous)
Moderate
Still okay for most, but if you have asthma or allergies, take it easy and avoid long outdoor workouts.
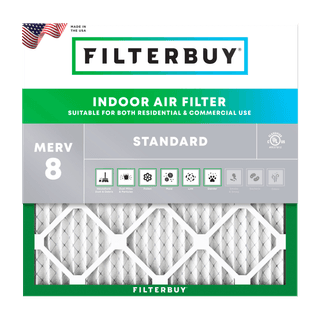
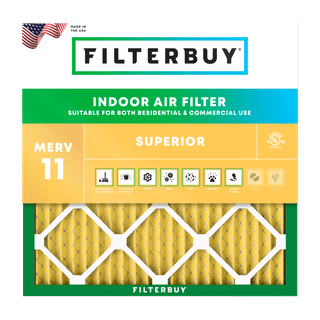
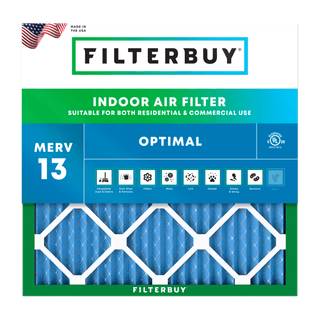
Shop MERV 11 filters→What's the Right Filter for Your AQI Level?


Check Today's Live Real Time Air Quality Index AQI Map in Austin, TX Now
Mountain cedar pollen takes over Central Texas every January, peaking high enough to give cedar fever to Austin residents who've never had allergies. That's the most dramatic part of the picture, not the only part. Ozone takes over from May through October. Wildfire smoke arrives whenever drought hits West Texas, Mexico, or the Rocky Mountain corridor. The single AQI number on your phone flattens all of it into one digit.
The dashboard above pulls hourly readings straight from EPA AirNow, the same network the City of Austin uses for its own alerts. Below the map, we cover what's actually driving today's reading, who in your house should pay closest attention, and what you can do indoors when outdoor air turns against you.
TL;DR Quick Answers
Is the air quality bad in Austin today?
Check the live AQI map at the top of this page. Below 50 is Good, 51 to 100 is Moderate, and anything over 100 is Unhealthy for Sensitive Groups or worse.
What is the AQI in Austin right now?
The current numerical reading and color band update hourly from EPA AirNow data, displayed in the dashboard above.
What's the Austin pollen count today?
Mountain cedar dominates from mid-December through late February, with January peaks well into the tens of thousands of grains per cubic meter. Oak takes over in March and April. Grasses, ragweed, and other warm-season pollens run May through October. The live pollen index sits next to the AQI display.
Is there wildfire smoke in Austin?
The smoke status indicator above shows whether elevated PM2.5 is currently present and identifies the source region when active.
Top Takeaways
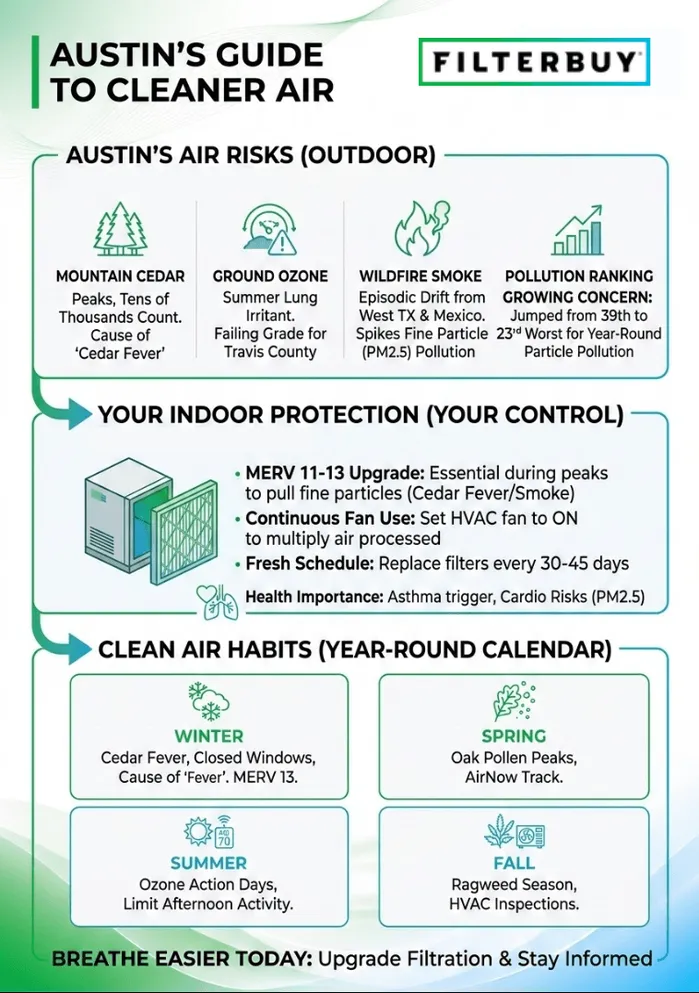
Austin's three big air quality threats run on different calendars: cedar pollen in winter, ozone in summer, and wildfire smoke episodically year-round.
Travis County earned a failing grade for ozone in the most recent State of the Air report, and the metro jumped from 39th to 23rd worst in the nation for year-round particle pollution.
Indoor air is the half of the day most homeowners overlook, and it's also the half they have the most control over.
A MERV 11 to MERV 13 filter, run with the HVAC fan on continuous, makes a measurable difference during cedar fever and wildfire smoke events.
Replace filters every 30 to 45 days during peak season, not the standard 90, for households across the Austin metro.
What Austin's Air Quality Looks Like Today
The reading at the top of this page sorts into one of six EPA categories. Anything 0 to 50 is Good. Up to 100 is Moderate. Past 100, you've crossed into Unhealthy for Sensitive Groups, then Unhealthy, then Very Unhealthy, then Hazardous. Each band carries its own activity guidance, which the dashboard tooltip spells out.
What that single number can't show you is what's driving it. In Austin, three local factors do most of the work. Cedar takes the winter. Ozone takes the summer. Wildfire smoke shows up whenever conditions to the west and south push it east.
Mountain cedar, formally known as Ashe juniper, releases its pollen each winter from the dense stands west of I-35. The pollen cones open after every cold front. Dry, gusty conditions launch the cloud into the air column. Cedar fever follows: heavy fatigue, sinus pressure, watery eyes, a sore throat that mimics a virus. Despite the name, no fever is involved, just an allergic reaction strong enough to feel like one.
Ozone is summer's problem. Hot, sunny, low-wind afternoons let sunlight cook the volatile compounds rising off Austin's traffic and gas equipment, and the result is a lung irritant that peaks between 2 and 6 p.m. The Texas Commission on Environmental Quality issues Ozone Action Day alerts ahead of forecasted bad days. Travis County earned a failing grade for ozone in the American Lung Association's most recent State of the Air report, with roughly six unhealthy ozone days per year.
Wildfire smoke is the wildcard. Brush fires in West Texas, drought-driven blazes in northern Mexico, and the occasional Rocky Mountain corridor event can push PM2.5 readings into the orange or red bands within a few hours. The Capital Area Council of Governments tracks regional smoke transport, and the City of Austin issues advisories whenever sustained drift is forecast.
Smoke that travels hundreds of miles is a function of how a wildfire burns, and the open encyclopedia entry on the topic covers the science.
Beyond those three, Austin's traffic corridors push localized PM2.5 higher in homes within a few hundred feet of I-35, MoPac, or US-183. Construction lifts dust as the metro adds housing. Saharan dust events occasionally raise PM10 across the region in late June and July. Each of these shows up in the live readings above.
For the wider view across the rest of the state, the live Texas AQI map breaks down current readings by metro and county.
Why Indoor Filtration Matters During Austin's Worst Air Days
At Filterbuy, we obsess over indoor air. It's the half of the day Austin homeowners can actually control, and our Travis County customer data has pointed the same direction for years. Switch from a MERV 8 to a MERV 13 during cedar season, and the difference shows up inside a week in two places: the dust caught on the return register, and how the people in the house feel.
“After manufacturing filters for over a decade and serving more than two million households, what we hear from our Austin customers is consistent: the families who upgrade to MERV 11 or MERV 13 during cedar season report fewer sick days and better sleep, even when outdoor pollen counts match prior years. Indoor air is the half of the day people forget about, and Austin's outdoor exposure makes that half count for more than most U.S. metros.”
— Filterbuy Team
The science backs up what our customers describe. A higher-rated filter pulls a larger share of fine particles and pollen on each pass through the HVAC return. Setting the fan to run continuously, instead of letting it cycle off when the AC compressor stops, multiplies the air it sees across the day. Combine the two during a wildfire smoke event, and indoor PM2.5 stops tracking the outdoor number hour by hour.
7 Essential Resources for Tracking Austin's Air Quality
Save the seven sources below. We pull from this same set internally to keep up with Austin's air.
Real-time AQI for monitoring stations across Texas, color-coded for ozone and particulate matter, refreshing throughout the day. Source: EPA AirNow Texas Air Quality Map
Daily TCEQ-issued forecast covering ozone, PM2.5, and PM10 for each Texas metro, with Austin-specific guidance during action day events. Source: Texas Commission on Environmental Quality Air Quality Forecast
Regional planning and monitoring for the five-county Austin-Round Rock-San Marcos MSA, including the Clean Air Coalition's pollution reduction plans. Source: Capital Area Council of Governments Air Quality Program
Local Ozone Action Day alerts and the Air Central Texas regional initiative. Sign up here for direct notifications when air quality is forecast to be unhealthy. Source: City of Austin Air Quality Program
Active air quality alerts in the NWS Austin/San Antonio County Warning Area, plus links to forecast guidance from the National Air Quality Forecast Capability. Source: National Weather Service Austin/San Antonio Air Quality Page
Federal guidance on protecting your household when wildfire smoke arrives, including respirator selection, clean room setup, and protection for children, older adults, and people with chronic conditions. Source: CDC Wildfire Smoke Safety Guidelines
The federal explanation of how PM2.5 and PM10 affect lung and heart health, with linked research and exposure-reduction guidance. Source: U.S. EPA Particulate Matter Health Effects.
3 Statistics Every Austin Resident Should Know
Our customer service data lines up with the public reporting on a few specific points. These three come up most often.
The Austin-Round Rock-San Marcos metro area now ranks 23rd worst in the nation for year-round particle pollution, jumping from 39th in the prior year's report. Travis County earned a failing grade for ozone with roughly six unhealthy days per year, according to the American Lung Association's State of the Air report. https://www.lung.org/research/sota/city-rankings/msas/austin-round-rock-san-marcos-tx
More than 2.2 million Texans (adults and children combined) live with asthma, and uncontrolled asthma drove over 109,000 emergency department visits and 8,500 hospital admissions in 2023 alone. Outdoor air quality is one of the most-cited triggers in the state's surveillance data, per the Texas Department of State Health Services. https://www.dshs.texas.gov/sites/default/files/CHI-Asthma/Docs/Reports/Impact-of%20Asthma-in-Texas-2025-Report.pdf
Short-term exposure to PM2.5 over a few hours to a few weeks can trigger heart attacks, strokes, and arrhythmias in people with existing cardiovascular disease, and EPA research has found elevated risk in healthy adults, too. That's the same particle size that dominates wildfire smoke. https://www.epa.gov/air-research/air-pollution-and-cardiovascular-disease-basics
Final Thoughts on Living With Austin's Air
Austin's air isn't catastrophic by national standards, but it isn't clean. Year-round particle pollution has trended the wrong way in recent reports. Cedar season is uniquely Central Texan. Ozone we share with every fast-growing southern metro. The wildfire smoke risk is climate-driven, and it's likely to keep growing as drought patterns continue across Texas, the Southwest, and northern Mexico.
Years of watching these numbers tell us the same thing: the Austin households that do best are the ones that treat indoor air as their own responsibility to manage. Outdoor conditions stay beyond any single family's daily reach. A higher-MERV filter, a fan kept on continuously during smoke or pollen events, and a tighter replacement schedule during peak weeks all add up to measurably cleaner air inside, regardless of what's happening at the curb.
If your home sits inside the Austin-Round Rock-San Marcos metro, the standard filter that came with your HVAC system is almost certainly underspecified for the conditions outside your front door from December through February and again from May through October. Upgrading is one of the cheapest, most-effective health investments any homeowner or renter can make in this region.
Next Steps for Protecting Your Austin Home
The Austin-specific protection plan splits into three timeframes.
Today, regardless of the current AQI
Find your filter size by reading the side of your current filter or measuring the slot dimensions.
Note your HVAC filter slot location (return-side, in the air handler, or both).
Check whether your thermostat has a fan-on / fan-auto setting and switch to fan-on during any AQI reading above 100.
Sign up for EPA AirNow phone alerts so the next reading change reaches you before you walk out the door.
Seasonal
Mid-November through the end of February: keep windows closed, run a pollen-grade filter, and replace it every 30 to 45 days during peak cedar weeks.
May through October: track TCEQ Ozone Action Day alerts and limit afternoon outdoor activity for kids and older adults on flagged days.
During wildfire smoke advisories: switch HVAC to recirculate, keep doors closed when possible, and consider a portable HEPA unit for bedrooms.
Ongoing
Subscribe to City of Austin and TCEQ alert emails for advance notice of poor-air-quality days.
Review your filter inventory at the start of each season so you're not scrambling during a peak event.
For households with asthma, COPD, infants, or older adults, step up to MERV 13 year-round and add activated carbon for ozone and odor control.
Frequently Asked Questions
Protect Your Austin Home With the Right Filter
For the cost of a couple of takeout dinners, the right filter handles most of what Austin's air can throw at your house and the people inside it. Browse Filterbuy's MERV 8, MERV 11, and MERV 13 options sized to your HVAC system and shipped from American manufacturing facilities. Custom sizes work for older Austin homes with non-standard filter housings.