
Santa Ana Real-Time AQI Tracker


Get Alerts For Unhealthy AQI In Your Area
When air quality in your area reaches unhealthy levels, we'll send you a quick alert, along with expert tips on how to reduce your exposure.
What's Actually In Santa Ana Air Today?
What High AQI Means for Your Lungs in Santa Ana
How to Read AQI
The Air Quality Index (AQI) measures how polluted the air is and how it may affect your health.
0–50 (Good): Air quality is satisfactory.
51–100 (Moderate): Acceptable, but some pollutants may pose minor concerns.
101–150 (Unhealthy for Sensitive Groups)
151–200 (Unhealthy)
201–300 (Very Unhealthy)
301+ (Hazardous)
Moderate
Still okay for most, but if you have asthma or allergies, take it easy and avoid long outdoor workouts.
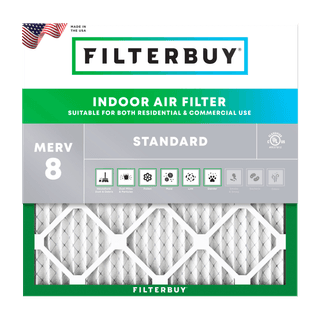
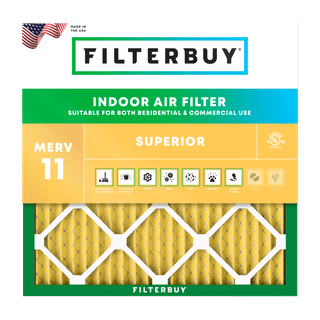
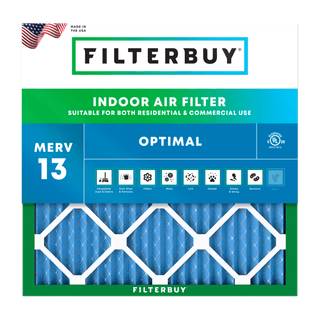
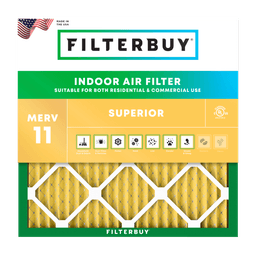
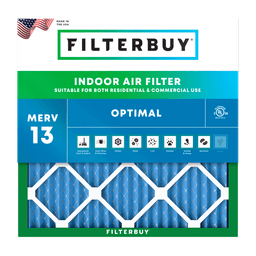
Shop MERV 11 filters→What's the Right Filter for Your AQI Level?


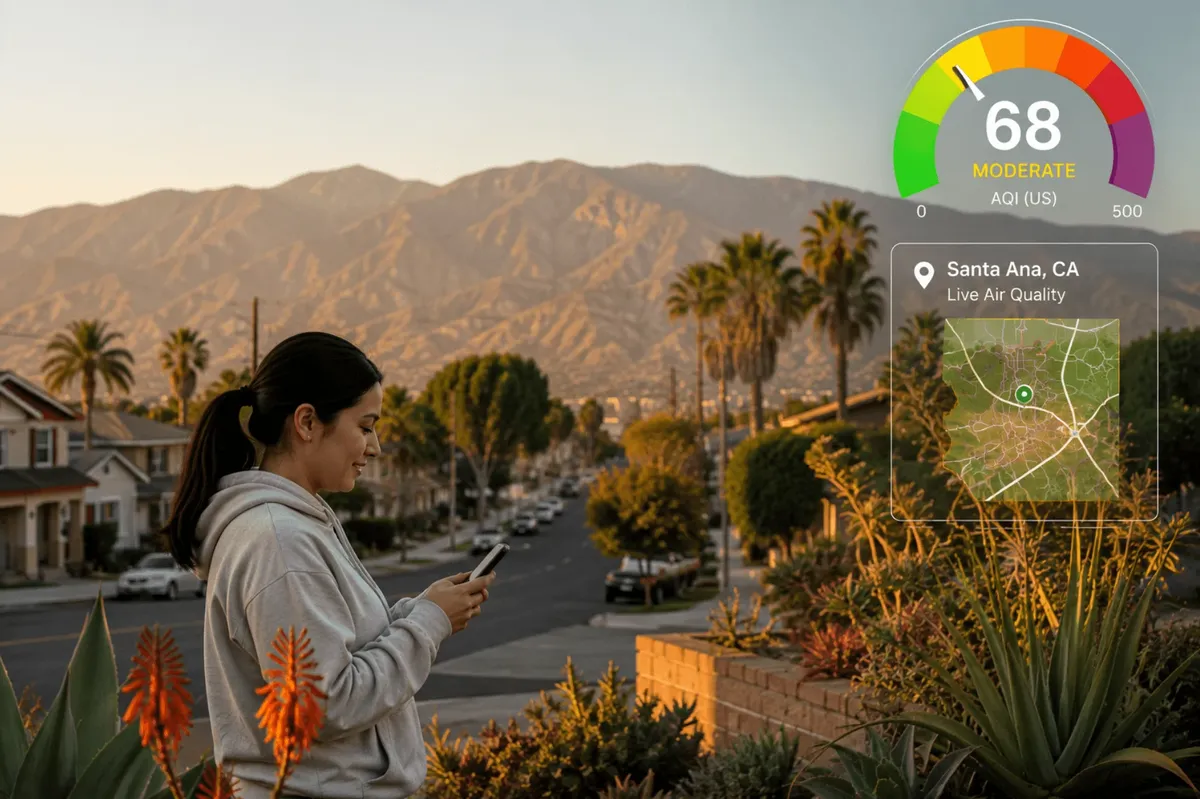
Check Today's Live Real Time Air Quality Index AQI Map in Santa Ana, CA Now
By Michelle Wan, Brand Manager & Air Quality Writer. Reviewed by David Clark, Licensed HVAC Technician. Publish Date: July 17, 2026. Updated Date: July 17, 2026
TL;DR
Santa Ana, CA air quality changes throughout the day, and the fastest way to check current conditions is a live AQI map rather than a fixed number. The U.S. EPA's Air Quality Index rates Santa Ana's air on a scale from Good to Hazardous based on ozone and PM2.5 readings from South Coast Air Quality Management District monitors. Use the live map below to see today's real-time AQI for Santa Ana, then scroll down for what the reading means and how to protect your family when it turns unhealthy.
Santa Ana, CA Live Air Quality Index Map
Santa Ana's live AQI right now comes from EPA and South Coast AQMD ground monitors and updates hourly through the NowCast system, so the number you see can shift as conditions change through the day. Check the interactive map below for Santa Ana's current AQI, primary pollutant, and today's forecast before you plan outdoor time.
At Filterbuy, we manufacture the air filters that help keep this pollution out of homes, so we watch these readings closely. Our advice for Santa Ana neighbors is simple. Treat the live AQI like a weather check during fire season, not a once-a-day glance, because the number can climb from Good to Unhealthy between your morning coffee and the afternoon school pickup.
Key Takeaways
Santa Ana's AQI is reported by EPA and South Coast AQMD monitors and can change hour to hour, so a live map is more reliable than yesterday's number.
The U.S. AQI runs from 0 to 500 across six color-coded categories, from Good (green) to Hazardous (maroon).
Ozone and PM2.5 (fine particle pollution) are the two pollutants that most often drive Santa Ana's AQI.
Freeway corridors, John Wayne Airport, and regional wildfire smoke are the main contributors to higher readings in Santa Ana.
When the AQI reaches Unhealthy for Sensitive Groups or higher, running a high-efficiency filter like a Filterbuy MERV 13 is one of the most effective ways to protect your household indoors.
Santa Ana is part of South Coast AQMD's four-county jurisdiction, one of the most closely monitored air basins in the country.
Understanding Santa Ana's Air Quality Index Today
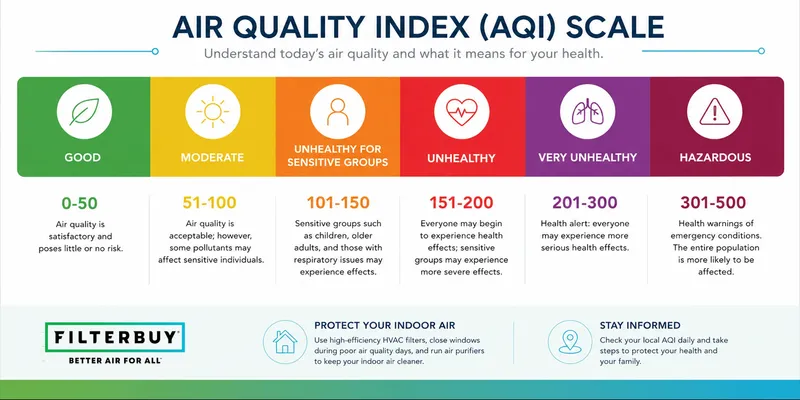
Santa Ana's AQI is a 0-to-500 scale that the EPA uses to translate raw pollutant concentrations into a single, easy-to-read number and color. A reading of 50 or below is Good, a reading above 300 is Hazardous, and every AQI value of 100 lines up with the national health-based standard for that pollutant. The table below breaks down each category and what it means for daily activity in Santa Ana.
| AQI Range | Category | What It Means For Santa Ana |
|---|---|---|
| 0–50 | Good | Air quality poses little or no risk. Safe for all outdoor activity. |
| 51–100 | Moderate | Acceptable for most people. Unusually sensitive individuals may notice minor effects. |
| 101–150 | Unhealthy for Sensitive Groups | Children, older adults, and people with heart or lung conditions should reduce prolonged outdoor exertion. |
| 151–200 | Unhealthy | Everyone may begin to experience health effects. Sensitive groups should limit outdoor activity. |
| 201–300 | Very Unhealthy | Health alert. Everyone should avoid prolonged outdoor exertion. |
| 301–500 | Hazardous | Health emergency. Everyone should avoid all outdoor exertion. |
How To Read Santa Ana's Live AQI Map
At Filterbuy, we read Santa Ana's live map every day to time our own advice, and it gives you more than one number once you know where to look. Here's how we read it in a few seconds.
Start with the big NowCast number and its color. That's Santa Ana's air quality category right now.
Check the primary pollutant next. Santa Ana's worst readings come from either ground-level ozone or PM2.5, and the two peak in different seasons.
Glance at the forecast last. It predicts where the number is heading later today, so you can plan outdoor time around it.
The number won't tell you everything, and two limits matter most here. The AQI shows only the single highest pollutant at that moment, so on a hot, smoky afternoon both ozone and PM2.5 can run high even though the map displays just one. The reading also comes from the nearest monitor, which covers a wide reporting area rather than your exact block, so air near a freeway or the edge of an active fire can be worse than the citywide number. If you can smell smoke or see haze while the map still reads moderate, treat your own surroundings as the more cautious signal and take precautions anyway.
What Causes Air Pollution In Santa Ana, CA
Santa Ana sits inside Orange County, part of South Coast AQMD's four-county air basin that covers more than 10,700 square miles and over 16 million residents. Vehicle traffic along the I-5, SR-55, and SR-22 corridors is the largest local source of nitrogen oxides and fine particles in Santa Ana. John Wayne Airport, nearby warehouse and industrial activity, and dust from construction add to the mix on top of that traffic load. The wider Los Angeles and Anaheim metro that surrounds Santa Ana consistently ranks among the worst U.S. metros for air quality, according to Filterbuy's analysis of EPA data. Ground-level ozone tends to peak on hot, sunny afternoons, while PM2.5 concentrations climb during winter inversions and during wildfire smoke events.
In our experience serving Orange County households, demand for higher-efficiency filters rises right alongside summer ozone and fire-season smoke. That pattern tracks the calendar of this basin almost perfectly. The pollution you read about on the map outdoors is the same pollution working its way into your living room, which is exactly where you can do something about it.
How Santa Ana Winds And The Coast Shape Local Air
Santa Ana's air quality depends as much on wind and geography as on what gets emitted nearby. Cool ocean air off the Pacific usually flushes the basin overnight and keeps morning readings low. When the Santa Ana winds reverse that flow in fall and winter, they can either sweep pollution offshore or push wildfire smoke straight across Orange County, which is why one week can swing from clean to hazardous.
This is the part most air quality reports leave out. The marine layer that rolls in overnight acts like a daily reset for Santa Ana's air, so early morning is often the cleanest window for a run or a walk. Santa Ana wind events flip that pattern. Hot, dry, fast-moving air from the interior can carry smoke from fires burning well outside the county, and it dries out local vegetation in a way that raises fire risk at the same time. When you see a Santa Ana wind event in the forecast, treat it as a day or two of warning that the air could turn, and check the live map more often than usual.
Santa Ana Air Quality By Season
Santa Ana's dominant pollutant changes with the calendar, so the precaution that helps most in July is not the one that helps most in December. Ozone peaks in the hot months, fine particle pollution climbs in winter, and wildfire smoke is most likely in fall. The table below shows what tends to drive Santa Ana's air quality in each season and the one habit that helps most.
| Season | Main Concern | What Tends To Drive It | One Smart Habit |
|---|---|---|---|
| Spring (Mar–May) | Pollen and early ozone | Warming days and blooming plants | Run your HVAC fan to filter indoor air on high-pollen days |
| Summer (Jun–Aug) | Ground-level ozone | Heat reacting with traffic and industrial emissions | Move outdoor exercise to the early morning |
| Fall (Sep–Nov) | Wildfire smoke and Santa Ana winds | Fire season plus hot, dry offshore winds | Check the live map daily and keep a MERV 13 filter on hand |
| Winter (Dec–Feb) | Fine particle pollution (PM2.5) | Temperature inversions trapping traffic and wood smoke | Skip wood burning and change your filter on schedule |
How Wildfire Smoke Affects Santa Ana's Air Quality
Wildfire smoke can push Santa Ana's PM2.5 readings well above the levels produced by everyday traffic and industrial sources, even when the fire itself burns dozens of miles away. Short-term exposure to wildfire-sourced PM2.5 is linked to increased respiratory and cardiovascular hospital visits, an effect researchers have documented across multiple U.S. wildfire seasons.
The mistake I see most often is people trusting their eyes. Santa Ana’s sky can look perfectly blue while PM2.5 from a fire fifty miles away is already climbing, because the finest smoke particles are invisible. Checking the live number, not the view out the window, is the habit that keeps a family a step ahead here.
Michelle Wan, Brand Manager & Air Quality Writer, Filterbuy
We've watched Santa Ana's AQI jump from Good to Unhealthy in a single afternoon once smoke moves into Orange County, which is exactly why a live map beats a daily average during fire season. The part you can control is your indoor air quality, which stays in your hands even when the outdoor number does not.
After years of making filters, the Filterbuy team has learned something most homeowners never hear. The flat fiberglass filter shipped with many systems is designed to protect the equipment, not the people breathing the air. It catches the large debris that can clog a blower motor, yet it lets the fine wildfire particles that actually reach your lungs pass straight through. That gap is the whole reason we build higher-efficiency pleated media, and it is the single point we wish every Santa Ana household understood before the next red-flag day.
How To Protect Your Family When Santa Ana's AQI Turns Unhealthy
Once Santa Ana's outdoor AQI crosses into Unhealthy for Sensitive Groups, outdoor air seeps into a home through open windows and small gaps around the building envelope. Your most effective response is simple. Close the windows and run your HVAC system's fan continuously so it keeps cycling indoor air through a higher-efficiency MERV-rated filter while the outdoor reading stays high.
A MERV 13 filter is built to capture a much higher share of fine particles, including wildfire smoke and PM2.5, than the standard filter that ships with most residential HVAC systems. For homes in wildfire-prone Southern California, that extra capture rate is the difference that matters most on smoke days. It is the same MERV 13 filter Filterbuy builds, and we run it in our own homes during fire season. It is the one we would hand a neighbor in Santa Ana without a second thought.
After manufacturing filters for over a decade and serving more than two million households, we've learned that the one part of air quality a Santa Ana family can truly control is the air inside their own home. When the AQI climbs, the right filter changed on time protects your household more than almost anything else you can do indoors.
David Heacock, Founder & CEO, Filterbuy
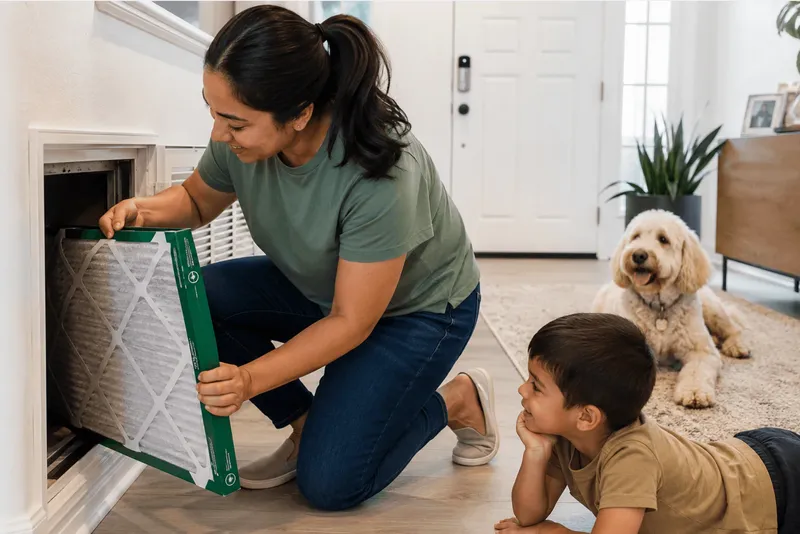
Your Smoke-Day Action Checklist For Santa Ana
When Santa Ana's AQI climbs into the orange band or higher, a short routine protects your household better than reacting after symptoms start. Work through this checklist as soon as the live map turns.
Check the live AQI map and note the primary pollutant before you plan the day.
Close windows and doors, and switch your HVAC system to recirculate if it has a fresh-air intake.
Run the system fan continuously so your filter keeps cleaning the air, not just when heating or cooling runs.
Install a MERV 13 filter if you have one, and set a reminder to change it sooner than usual during a smoke event.
Set up one clean room where children, older adults, or anyone with heart or lung conditions can spend the most time.
Limit outdoor exercise, and move whatever stays outdoors to the cleaner early-morning window.
Check on neighbors in sensitive groups, since a quick text can matter more than any gadget during a bad-air stretch.
Where To Check Santa Ana's Live AQI Map
The fastest official sources for Santa Ana's real-time AQI are AirNow.gov, which pulls directly from EPA and South Coast AQMD monitors, and the South Coast AQMD
air quality page, which covers current and forecast air quality across Orange County.
Frequently Asked Questions
Glossary
AQI (Air Quality Index)
EPA's 0-to-500 scale for reporting daily outdoor air quality and its associated health risk, divided into six color-coded categories.
PM2.5
Fine particulate matter measuring 2.5 microns or smaller in diameter, small enough to reach deep into the lungs and bloodstream.
NowCast
EPA's real-time AQI calculation method that weights recent monitor readings more heavily to reflect fast-changing air quality within a single day.
South Coast AQMD
South Coast Air Quality Management District, the regional agency responsible for air pollution control across Orange County and large portions of Los Angeles, Riverside, and San Bernardino Counties.
MERV Rating
Minimum Efficiency Reporting Value, a 1-to-16 scale rating how effectively an HVAC filter captures airborne particles, with MERV 13 capturing a high share of fine particles including wildfire smoke.
Ground-Level Ozone
A gas formed when vehicle and industrial emissions react with sunlight, typically peaking on hot, sunny afternoons.
Unhealthy For Sensitive Groups
The AQI category (101-150, orange) at which children, older adults, and people with heart or lung conditions may begin experiencing health effects.
Santa Ana Winds
Hot, dry winds that blow from the interior toward the Southern California coast, mainly in fall and winter, and can either clear coastal smog offshore or carry wildfire smoke across Orange County.
Marine Layer
A band of cool, moist ocean air that moves inland overnight and often lowers Santa Ana's morning pollutant readings before it burns off during the day.
Temperature Inversion
A weather pattern, common in winter, where a layer of warm air traps cooler air and pollution near the ground instead of letting it disperse upward.
Clean Room
A single room set up to keep smoke and fine particles as low as possible, using a well-filtered HVAC system or a portable air cleaner, where sensitive family members can spend the most time during a smoke event.
Primary Pollutant
The pollutant with the highest AQI at a given moment, and the one the single AQI number on the map reflects. In Santa Ana this is usually ground-level ozone in summer or PM2.5 during winter and wildfire smoke.
Reporting Area
The geographic area that a monitor's AQI represents. It can cover a wide part of a city, so your exact block near a freeway or a fire edge may differ from the reported number.
Supporting Statistics
Three research-backed figures back up the copy above. Each comes from a separate U.S. government source you can check yourself.
1.3% to 10%
1. Wildfire smoke is harder on your lungs than everyday pollution.
Wildfire PM2.5 raised respiratory hospitalizations 1.3% to 10% per 10 µg/m³.
PM2.5 from other sources raised them just 0.67% to 1.3%.
So Santa Ana's fire-season spikes carry outsized risk (Aguilera et al., 2021).
Source: National Institutes of Health / PMC
~7,200 fewer deaths a year
2. Cleaner PM2.5 would save thousands of Californians.
Cutting PM2.5 to background would avoid about 7,200 premature deaths a year.
It would also avoid roughly 1,900 hospitalizations and 5,200 ER visits.
Over 90% of Californians already breathe unhealthy air part of the year.
Source: California Air Resources Board
11,347 per square mile
3. Santa Ana packs a lot of people into a polluted basin.
The city holds 310,227 residents at about 11,347 per square mile (2020 Census).
Freeway traffic and wildfire smoke both drive local pollution up.
A live local reading and good filtration help most where people are packed in.
Source: U.S. Census Bureau QuickFacts (2020 Census)
Seven Air Quality Sources We'd Send Our Own Families To
We're obsessed with what's floating in the air your family breathes, and that obsession doesn't stop at our own filters. The sources below are the government agencies and health nonprofits we rely on ourselves, each one built to turn invisible pollution into something you can actually see and act on. You're the one protecting your household, and these resources help you do it with confidence.
Read Any AQI Number With Confidence
Start here, because a number only helps once you know what it's telling you. AirNow's guide to using the Air Quality Index breaks down every color band and shows how the hourly NowCast keeps your reading current, so a Good or Unhealthy label always turns into a clear next step for your family.
Understand How Wildfire Smoke Threatens Your Health
Smoke is one of the hardest parts of Santa Ana's air to predict, and we want you ready before it arrives. The EPA's wildland fire and smoke resource explains how smoke travels and who faces higher health risk during a fire, giving you a federal-grade starting point for a smoke-ready plan.
Follow Smoke Guidance Built For Southern California
National advice is a fine start, but you live in the South Coast air basin, and so does this guidance. South Coast AQMD's wildfire smoke guidance is written for the exact air Santa Ana breathes, with practical steps we'd follow in our own homes to protect a household when smoke rolls in.
Connect Directly With Santa Ana's Local Air Authority
When you want answers straight from the source, go local. The City of Santa Ana's air quality page links you right to the regional agency that monitors and regulates the air over your neighborhood, whether you need city-level context or want to report a concern you're seeing firsthand.
Check Orange County's Official Air Quality Report Card
Ever wonder how your county actually scores? The American Lung Association's State of the Air report card grades Orange County on ozone and particle pollution every year, giving you a quick, honest read on how the air around you measures up to national health standards.
See How Air Pollution Affects Your Body Over Time
This is the part that's easy to ignore, because the damage builds quietly. The CDC's overview of air pollution and health shows what breathing polluted air does to your heart and lungs over months and years, not just on the obvious bad-air days, so you understand why steady protection matters.
Look Up Air Pollution Health Effects In Plain Language
Sometimes you just want a straight answer without the jargon. MedlinePlus, from the National Library of Medicine, lays out air pollution's health effects in plain, patient-friendly terms, making it a dependable place to check symptoms and risks whenever a question comes up.
Related Filterbuy Resources
Ready for more? These Filterbuy guides answer the filter and air quality questions Santa Ana households ask us most, from picking the right MERV rating to checking the air inside your own home.
Which MERV Rating Should I Use? (MERV rating guide)
American-Made MERV 13 Air Filters (category page)
Improving Home Air Quality (indoor air quality resource)
U.S. Cities with Worst and Best Air Quality (Filterbuy study)