
Pomona Real-Time AQI Tracker


Get Alerts For Unhealthy AQI In Your Area
When air quality in your area reaches unhealthy levels, we'll send you a quick alert, along with expert tips on how to reduce your exposure.
What's Actually In Pomona Air Today?
What High AQI Means for Your Lungs in Pomona
How to Read AQI
The Air Quality Index (AQI) measures how polluted the air is and how it may affect your health.
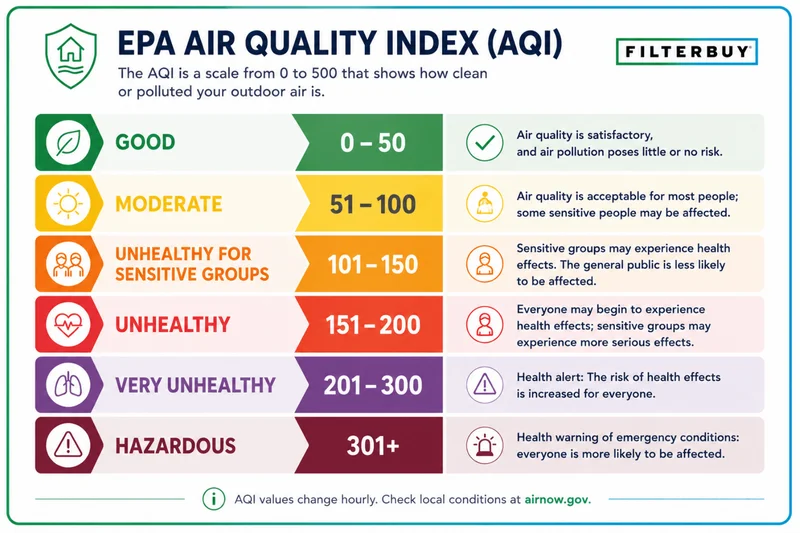
0–50 (Good): Air quality is satisfactory.
51–100 (Moderate): Acceptable, but some pollutants may pose minor concerns.
101–150 (Unhealthy for Sensitive Groups)
151–200 (Unhealthy)
201–300 (Very Unhealthy)
301+ (Hazardous)
Moderate
Still okay for most, but if you have asthma or allergies, take it easy and avoid long outdoor workouts.
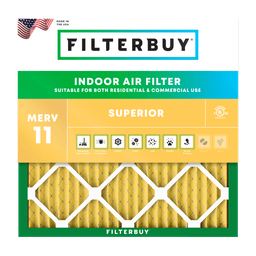
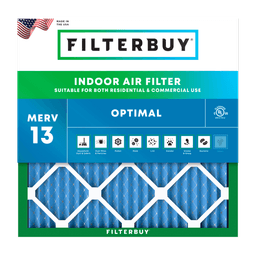
Shop MERV 11 filters→What's the Right Filter for Your AQI Level?


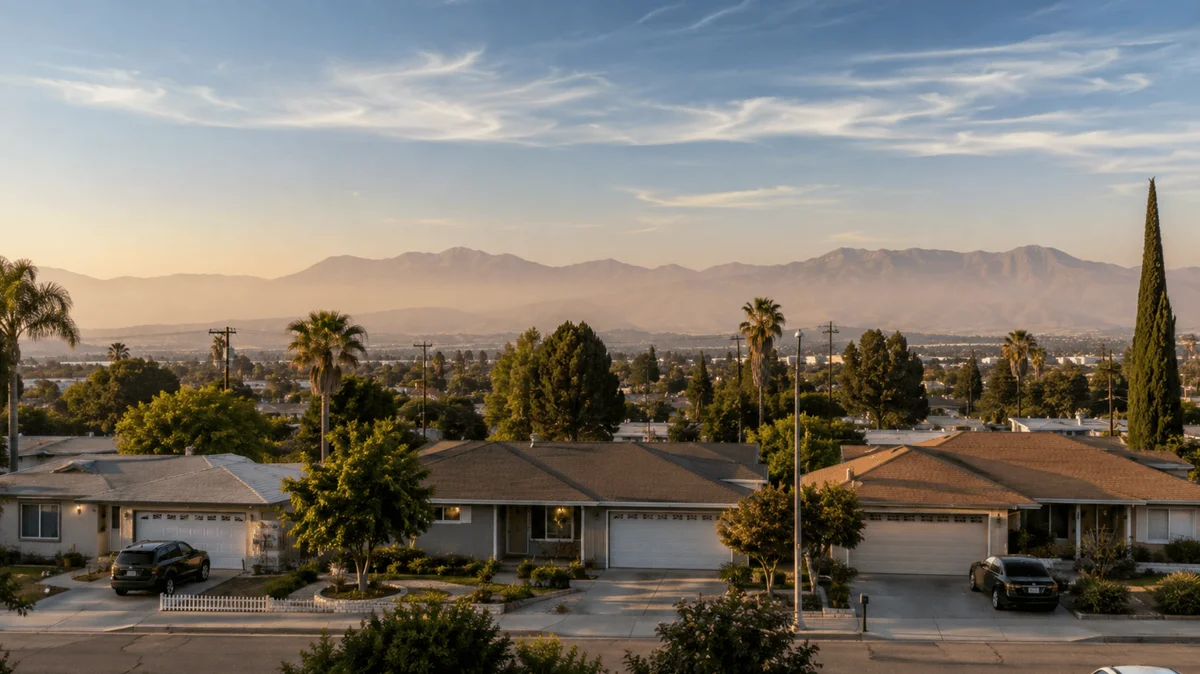
Check Today's Live Real Time Air Quality Index AQI Map in Pomona, CA Now
Author: Michelle Wan | Reviewer: David Clark, Licensed HVAC Technician | Publish Date: August 12, 2026 | Updated Date: August 12, 2026
Filterbuy manufactures air filters in the United States, and we built this page by pulling Pomona’s official monitoring record. The city no longer has one. South Coast AQMD closed the Garey Avenue station in January 2026. That single fact changes how you should read the number above, and no other Pomona air quality page we checked mentions it. Below is what we tell Pomona customers about reading that number, and what to do indoors once you have it.
View the South Coast AQMD live air quality map for Pomona
TL;DR
Pomona’s AQI is published hourly by EPA AirNow and South Coast AQMD, which forecasts the city as its own zone: Source Receptor Area 10, Pomona/Walnut Valley. Since the Pomona station closed in January 2026, that number is modeled from monitors in neighboring cities rather than measured in town, so read the color band and not the exact digits. Ozone drives most high readings from March through October, and no filter removes it. That one is handled with timing and closed windows. PM2.5 from diesel freight and wildfire smoke drives the rest, and that is what filtration is for.
Key Takeaways
South Coast AQMD forecasts Pomona as its own zone, Source Receptor Area 10 (Pomona/Walnut Valley), separate from East San Gabriel Valley next door.
The Pomona air monitoring station closed on January 1, 2026. No regulatory monitor operates inside the city now, so every "Pomona AQI" figure is modeled from surrounding stations, which is why two apps often disagree.
The nearest ozone monitor, in Glendora, is the design value site for the whole Los Angeles-Long Beach region: its readings decide whether the region meets the federal standard.
A pleated filter cannot remove ozone, which is Pomona’s dominant warm-season pollutant. Ozone needs timing and closed windows; filtration handles the diesel PM2.5, smoke and pollen.
The Los Angeles-Long Beach metro area, which includes Pomona, has ranked worst in the nation for ozone in 26 of 27 years of American Lung Association reporting.
How to Read Today’s Pomona AQI Number
The Air Quality Index is a 0-to-500 scale the EPA uses to turn pollutant concentrations into health guidance. The number shown is whichever pollutant scores highest that hour. Here is what each band means in Pomona, and the filter we would put in your system at that level.
Why Two Air Quality Apps Show Two Different Pomona Numbers
Pomona customers ask Filterbuy this constantly, and until we went looking for the source data we did not have a good answer. Here it is. South Coast AQMD’s Annual Air Quality Monitoring Network Plan for July 1, 2026 records that the Pomona station on North Garey Avenue closed on January 1, 2026; nearby Upland closed in the same round. Even while it ran, that station measured only ozone, nitrogen dioxide and carbon monoxide. It never measured PM2.5, and Pomona has never had a PM2.5 monitor of its own.
So any "Pomona AQI" you see today is modeled, not measured on site. It is interpolated from stations in surrounding cities and blended with low-cost sensors, and apps weight those inputs differently. That is why a 20-point spread between two apps on the same afternoon is normal, not a malfunction. You can check the raw numbers yourself on South Coast AQMD’s monitoring site data page. It is the same page Filterbuy checks before recommending a filter to anyone in this valley.
Station list and pollutants from South Coast AQMD's Annual Air Quality Monitoring Network Plan, July 1, 2026. Distances are approximate. A design value site is the monitor whose readings determine whether a region meets federal standards for that pollutant.
For most days that is fine. Pick one source, ideally South Coast AQMD’s forecast for Area 10, and treat the number as a band. The gap between 62 and 71 changes nothing about your day. The gap between 71 and 130 changes a great deal. On the days when the band itself is the question, go to the instruments.
With No Monitor in Town, Which Station Should You Actually Watch?
If you want real instrument readings instead of a modeled number, match the station to the pollutant you care about.
For ozone, March through October: watch Glendora. It sits in the same inland position at the end of the same afternoon transport path, and it is the ozone design value site for the whole Los Angeles-Long Beach region.
For traffic PM2.5, year-round: watch Ontario Route 60 Near Road. It sits on the Pomona Freeway, the same source that reaches you.
For wildfire smoke: watch whichever station sits between you and the fire, not the closest one. Smoke arrives on the wind, not by distance.
One caveat, because it will save you a bad afternoon. South Coast AQMD classifies Ontario Route 60 as a microscale near-road monitor, built to capture the worst case within meters of the freeway rather than what a neighborhood breathes. Glendora is neighborhood-scale. If you live a mile off the 60, treat Ontario as your ceiling and Glendora as your floor.
Why Pomona Air Quality Turns Bad
Three causes explain most of Pomona’s high readings: ozone transported inland from the coastal basin, diesel exhaust from the freight corridor, and wildfire smoke. Which one drives today’s number depends on the season and the wind.
Ozone in Pomona (March Through October)
Ozone is not emitted directly. It forms when nitrogen oxides and volatile organic compounds cook in sunlight, which takes hours. That delay is why inland cities inherit the coastal basin’s morning emissions: the sea breeze pushes the ingredients east all day, and the reaction peaks over the Pomona Valley in the afternoon, just as the mountains stop the air from moving on. The Los Angeles-Long Beach region has ranked worst in the nation for ozone in 26 of 27 years of American Lung Association tracking, and inland valleys carry a disproportionate share.
Diesel and Traffic Emissions Along the Pomona Freeway Corridor
Pomona is boxed in by freight, and this is why Filterbuy pushes the baseline filter a step higher here than on the coast. State Route 60, the Pomona Freeway, moves about 43% of the goods traveling in and out of the Greater Los Angeles Basin. Southwest of the city, the 57/60 Confluence funnels roughly 350,000 vehicles a day, an estimated 26,000 of them trucks, through California’s worst truck bottleneck. Interstate 10 runs along the north side. Diesel exhaust feeds both PM2.5 and tomorrow’s ozone.
Wildfire Smoke Reaching Pomona
Smoke ignores the seasonal pattern. In September 2024 the Bridge Fire burned between Piñon Hills, Mount Baldy, La Verne and Crystal Lake. La Verne borders Pomona. Days earlier, South Coast AQMD’s September 8 advisory named the corridor between Pomona and the San Bernardino Mountains as facing the heaviest smoke, with PM2.5 forecast to reach Unhealthy or worse. Track active fires on the live California wildfire and smoke map.
What to Do Indoors When Pomona’s AQI Climbs
Outdoor numbers tell you when to act. Indoor filtration decides whether acting changes anything: the EPA estimates indoor pollutant levels commonly run two to five times higher than outdoor levels, and most people spend roughly 90% of their time inside. This is the ladder Filterbuy walks Pomona customers through, and it starts a step higher here than on the coast because of the freight traffic.
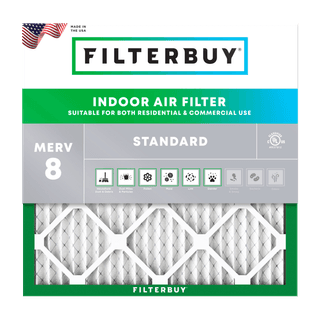
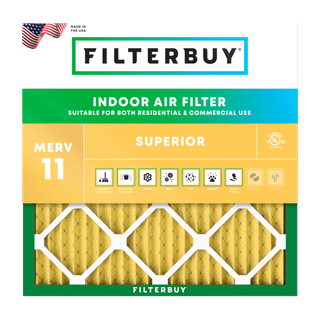
Green and Yellow, AQI 0–100. Filterbuy MERV 8 is the floor. Filterbuy recommends MERV 11 as the year-round Pomona baseline, because diesel particulate does not take the day off when the AQI reads Good.
Orange, AQI 101–150. Hold at MERV 11, close windows during the afternoon ozone peak, and switch the thermostat fan from AUTO to ON so filtered air keeps circulating.
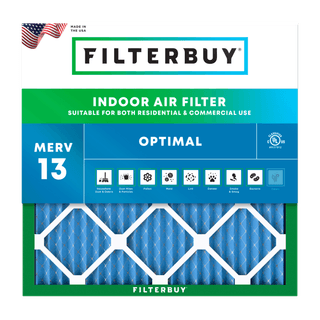
Red and above, AQI 151+. Filterbuy MERV 13 is the residential minimum during smoke, if your system can take it. Close any fresh-air intake, run the fan continuously, and add a portable air cleaner in the bedroom.
After the smoke clears. Keep the higher-rated filter in another week or two. Smoke particles settle, get stirred up, and keep circulating after the reading returns to Moderate.
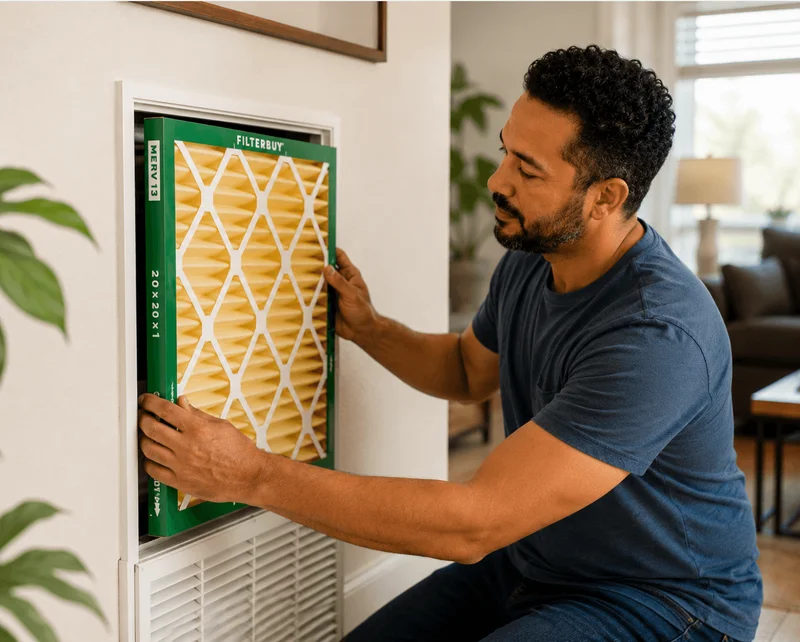
The question I get most from Pomona is why the number on their phone never matches their neighbor’s. I assumed the apps were sloppy. They are not. The city’s monitor is gone, so every one of those numbers is an estimate built from someone else’s station. Pick one source, watch the color band instead of the digits, and let that pick the filter.
Michelle Wan, Brand Manager and Air Quality Writer, Filterbuy
What a Filter Fixes in Pomona, and What It Does Not
Filterbuy sells filters, so take this in the spirit it is meant: a pleated filter will not fix Pomona’s biggest air problem. Ozone is a gas. Pleated media captures particles.
That matters here more than almost anywhere, because ozone is what puts this region at the top of the national rankings, and it peaks on the hot afternoons when you most want the AC running. On a high-ozone day the useful moves are behavioral: windows closed, system on recirculate rather than pulling outdoor air in, hard exercise moved to the morning. Ozone breaks down fast once it contacts indoor surfaces, so a closed-up house is already a partial defense. Activated carbon media, like Filterbuy Odor Eliminator filters, adsorbs some gases and helps at the margin. It is not an ozone solution and Filterbuy will not sell it as one.
Filtration earns its keep on the other half: diesel PM2.5 off SR-60 and I-10, wildfire smoke, spring pollen. Those are particles, and particles are what a filter is built for. Pomona needs both levers: timing for ozone, filtration for particulate. Most air quality pages mention only one of them.
The Best Time to Be Outside in Pomona Flips With the Season
The two dominant pollutants peak at opposite ends of the day, so the safest hours for a run or a kid’s practice invert twice a year.
Spring through fall, ozone season: mornings are cleanest. Ozone needs hours of sunlight to form, peaking roughly 1 to 6 p.m.
Winter, inversion season: afternoons are cleaner. Cold overnight air traps diesel exhaust near the ground until mid-morning sun breaks the layer up.
During smoke: neither. Smoke has no daily cycle. Check the map before every outing, not once in the morning.
What Pomona’s Housing Stock Means for Your Filter Choice
This is where most national air quality advice stops being useful in Pomona, so Filterbuy asked the licensed technician who reviews these pages to weigh in.
The median Pomona home was built around 1967, and roughly one in ten predates 1940. Blowers of that vintage were not engineered for the airflow resistance of a MERV 13 filter, so a jump straight to MERV 13 can restrict airflow instead of improving air.
Close to half of Pomona households rent, and many older homes rely on window units, wall furnaces or evaporative coolers rather than central forced air. South Coast AQMD is explicit here: during a smoke event, avoid swamp coolers and whole-house fans that pull outside air in. A portable air cleaner sized to one room does what a whole-house filter cannot, and it moves with you when the lease ends.
On a house this age I check the return before I talk about MERV at all. A single undersized return is the real limit, not the filter rating. Put a MERV 13 on it and the blower starves. If your return grille is smaller than about 20 by 25 inches and you only have one, step up to MERV 11 and run the fan continuously instead. You will move more filtered air in a day than a MERV 13 that chokes the system ever will.
David Clark, Licensed HVAC Technician and Technical Reviewer for Filterbuy
3 Statistics That Put Pomona’s Air in Context
None of these are Filterbuy numbers. All three come from government or public health sources, and each is checkable at the link.
1. Pomona’s Metro Area Averages 159.2 Unhealthy Ozone Days a Year
Worst ozone of any U.S. metro area.
7th worst for particle spikes: 13 unhealthy days a year.
More than 8 in 10 Californians live with unhealthy air.
Source: American Lung Association, State of the Air 2026 (2022–2024 data)
2. The Federal Cleanup Deadline Is 2038
The EPA rates the South Coast Air Basin "Extreme" nonattainment for ozone. That is the worst class there is.
Attainment deadline: August 3, 2038.
Current design value: 108 ppb. Federal limit: 70 ppb. Roughly 54% over.
Source: U.S. EPA, Ozone Designation and Classification Information
3. The Right Filter Cuts Indoor PM2.5 by About Half
High-efficiency filter, fan set to ON: about 50% less indoor PM2.5.
Basic filter, fan set to ON: about 24% less.
Windows closed, no air cleaner: indoor PM2.5 still runs 55–60% of outdoor.
Older homes let more of it in. Pomona’s median home dates to 1967.
Frequently Asked Questions
Glossary
Air Quality Index (AQI): The EPA’s 0-to-500 scale translating outdoor pollutant concentrations into color-coded health guidance.
PM2.5: Fine particulate matter 2.5 micrometers or smaller, small enough to reach deep lung tissue. The main pollutant in wildfire smoke and diesel exhaust.
Ground-Level Ozone: A lung irritant formed when nitrogen oxides and volatile organic compounds react in sunlight, distinct from the protective ozone layer high above.
Nitrogen Dioxide (NO2): A traffic-related gas and a precursor to ozone, measured at the Glendora and Ontario stations closest to Pomona.
Near-Road Monitor: A microscale station sited within meters of a freeway to capture worst-case traffic pollution. Its readings run higher than what a surrounding neighborhood breathes.
Design Value Site: The monitoring station whose readings determine whether an entire region meets a federal standard for a pollutant.
MERV Rating: Minimum Efficiency Reporting Value, the ASHRAE 1-to-16 scale for how effectively a filter captures particles.
Source Receptor Area (SRA): One of 38 forecast zones South Coast AQMD uses across its four-county jurisdiction. Pomona is SRA 10, Pomona/Walnut Valley.
South Coast AQMD: The regional agency regulating air pollution across Orange County and the urban portions of Los Angeles, Riverside and San Bernardino counties.