Nearly one in four Americans lives in a county with poor air quality. That figure comes from the EPA — and while conditions have gradually improved since the Clean Air Act passed in 1970, millions of people are still regularly breathing air that doesn't meet national health standards.
The causes vary by region. In the West, ozone and wildfire smoke are the dominant problems. In the industrial Midwest and mid-Atlantic, particle pollution and sulfur dioxide play a larger role. Economically disadvantaged communities tend to bear a disproportionate share of the burden — research consistently shows that higher pollution levels cluster in lower-income areas.
The good news is that outdoor air quality, while imperfect, has improved measurably over the past five decades — even as the U.S. economy, population, and energy use have all grown. The harder reality is that the most polluted metros in 1980 are still, for the most part, the most polluted today.
Air quality & your home
Nearly 1 in 4 Americans live in counties with poor air quality
Traffic, ozone, particle pollution, and wildfire smoke all push AQI levels higher — and outdoor air finds its way indoors. The right filter and change schedule can make a meaningful difference.
Worst region
Southern California
Median AQI 89 (Riverside)
Unhealthy days/year
145 days
Riverside metro, 2019
To identify which metropolitan areas have the worst and best air quality, researchers at Filterbuy analyzed median Air Quality Index (AQI) values published annually by the EPA. Higher AQI values indicate higher pollution and lower air quality. Only metros with at least 500,000 residents were included.
While many Americans are still living in places with unhealthy levels of air pollution, conditions have been improving in recent decades. Through EPA efforts and the passage of the Clean Air Act, the U.S. has seen gradual improvement in air quality and a decline in the emissions of common pollutants since 1970. CO2 emissions have also shown small declines since 2010. Such improvements have occurred even with steady increases in the gross domestic product, travel, total population, and energy consumption.
Still, air quality in many areas, especially in the Western U.S., does not meet national standards. In addition to causing environmental issues, poor air quality can have negative consequences for individual health, which can be particularly detrimental to those already suffering from certain health problems such as asthma and cardiovascular disease. Additionally, new research indicates that economically disadvantaged communities are more likely to face higher levels of pollution. Furthermore, while the US has improved as a whole, the most polluted areas from 1980 are still among the most polluted today.

To identify metropolitan areas with the worst (and best) air quality, researchers from Filterbuy analyzed median Air Quality Index (AQI) values for 2019. These values, published annually by the EPA, are a measure of an area’s air pollution. Higher AQI values indicate that an area experiences higher pollution levels and lower air quality.
For the purpose of this report, only metropolitan areas with at least 500,000 residents were included. Here are the metropolitan areas with the worst (and best) air quality in the nation.
TRENDING
Replacing home air filters regularly can dramatically improve the air quality in your home. If you are dealing with particularly problematic conditions, consider using MERV 13 air filters.
Metros with the Worst Air Quality
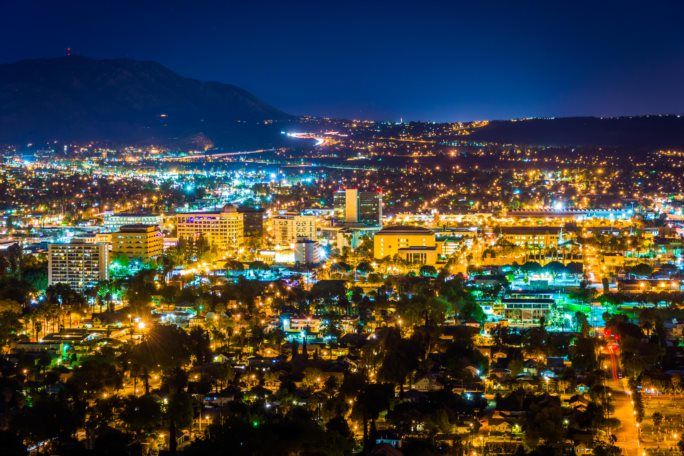
1. Riverside–San Bernardino–Ontario, CA
Metro area (MSA) · Riverside & San Bernardino Counties
Density (per sq mi)
168.6
2026 population
4,820,000
2020 population
4,600,000
Density change since 2020
+4.80%
Unhealthy / hazardous
150
Air quality note
The Inland Empire holds the most dubious air quality distinction in the United States. In the American Lung Association's 2026 State of the Air report, San Bernardino County ranked #1 and Riverside County #2 in the nation for ozone pollution — a position the LA metro area has held in 26 of the report's 27 years. Residents experience roughly five months of unhealthy air annually, driven by thousands of daily diesel trucks serving the region's massive warehouse and freight corridors, basin geography that traps smog inland from LA, and extreme summer heat that accelerates ozone formation. Both counties also rank in the nation's worst ten for PM2.5 particle pollution. The region is classified as an extreme ozone non-attainment zone and a severe PM2.5 non-attainment zone under federal EPA standards — the highest severity categories possible. MERV 13 is the only appropriate filter for Inland Empire households, and filters should be checked monthly and replaced every 30–45 days during summer smog season. Shop MERV 13 →
2. Riverside–San Bernardino–Ontario, CA
Metro area (MSA) · Riverside & San Bernardino Counties
Density (per sq mi)
168.6
2026 population
4,820,000
2020 population
4,600,000
Density change since 2020
+4.80%
Unhealthy / hazardous
150
Air quality note
The Inland Empire holds the most dubious air quality distinction in the United States. In the American Lung Association's 2026 State of the Air report, San Bernardino County ranked #1 and Riverside County #2 in the nation for ozone pollution — a position the LA metro area has held in 26 of the report's 27 years. Residents experience roughly five months of unhealthy air annually, driven by thousands of daily diesel trucks serving the region's massive warehouse and freight corridors, basin geography that traps smog inland from LA, and extreme summer heat that accelerates ozone formation. Both counties also rank in the nation's worst ten for PM2.5 particle pollution. The region is classified as an extreme ozone non-attainment zone and a severe PM2.5 non-attainment zone under federal EPA standards — the highest severity categories possible. MERV 13 is the only appropriate filter for Inland Empire households, and filters should be checked monthly and replaced every 30–45 days during summer smog season. Shop MERV 13 →
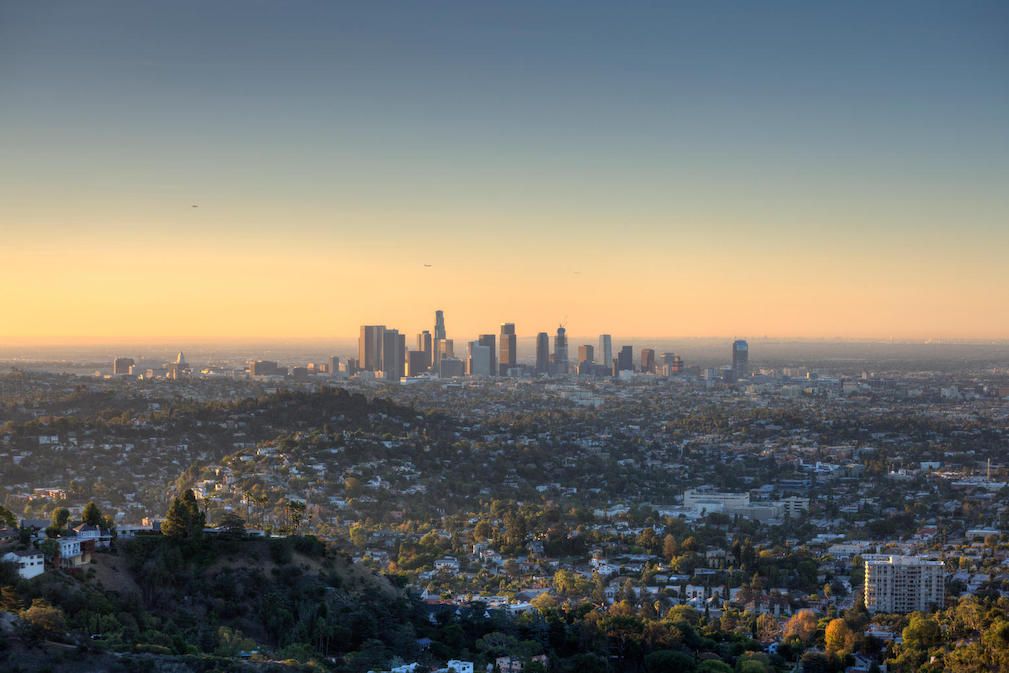
3. Los Angeles–Long Beach–Anaheim, CA
Metro area (MSA) · Los Angeles & Orange Counties
Density (per sq mi)
2,679.1
2026 population
12,920,000
2020 population
13,000,000
Density change since 2020
−0.62%
Air quality note
Los Angeles has held the title of most ozone-polluted metro in the U.S. for 26 of the past 27 years per the American Lung Association. The basin's ring of mountains traps vehicle emissions and port diesel inland, driving chronic ozone and PM2.5 non-attainment. The 2025 Max AQI of 500+ reflects the January Palisades and Eaton wildfires — the most destructive in LA history — which pushed daily averages into the "Unhealthy" range for days. Year-round, a MERV 13 filter is the right baseline for LA households, with monthly checks during summer ozone season and immediate replacement during any wildfire event. Shop MERV 13 filters →
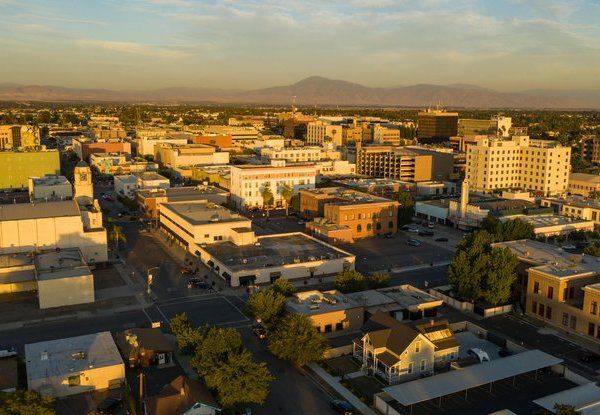
4. Bakersfield, CA
Midsize city · 250,000–499,999
Density (per sq mi)
2,837.2
Density change since 2020
+5.79%
Unhealthy / hazardous
120
Air quality note
Bakersfield ranked #1 in the U.S. for annual particle pollution in the American Lung Association's 2026 State of the Air report — a position it has held for most of the past two decades. The city sits in a natural bowl at the southern end of the San Joaquin Valley, where surrounding mountains trap emissions from Kern County's massive oil and gas industry — the most productive in California — alongside agricultural dust and diesel freight. PM2.5 and ozone both exceed federal standards year-round, with summer ozone season and fall harvest dust creating the worst spikes. A MERV 13 filter replaced every 45–60 days is the only appropriate choice for Bakersfield homes. Shop MERV 13 filters →
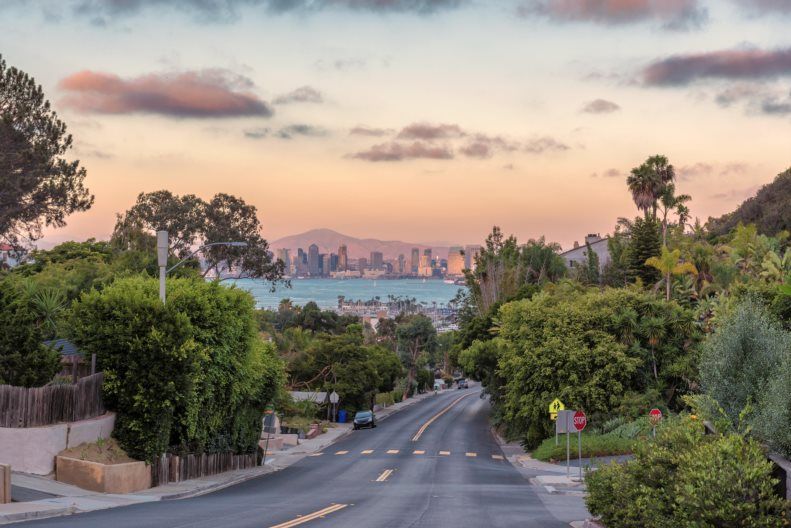
5. San Diego–Carlsbad, CA
Metro area (MSA) · San Diego County
Density (per sq mi)
783.5
2026 population
3,276,954
2020 population
3,298,634
Density change since 2020
−0.66%
Air quality note
San Diego's coastal location gives it one of the better air quality profiles among Southern California metros — earning a grade B from EPA monitoring data, with 43% of days in the "good" category in 2025. Pacific Ocean breezes continuously flush the airshed, keeping PM2.5 well below the federal standard most of the year. The primary concern is ozone, where San Diego still ranks among the top 10 worst metros nationally due to emissions drifting south from the LA basin and local vehicle traffic. Wildfire smoke from San Diego County's dry eastern canyons can push AQI into unhealthy territory during October–December Santa Ana wind events. A MERV 11 filter is the right year-round baseline, with replacement every 60–90 days. Shop MERV 11 filters →
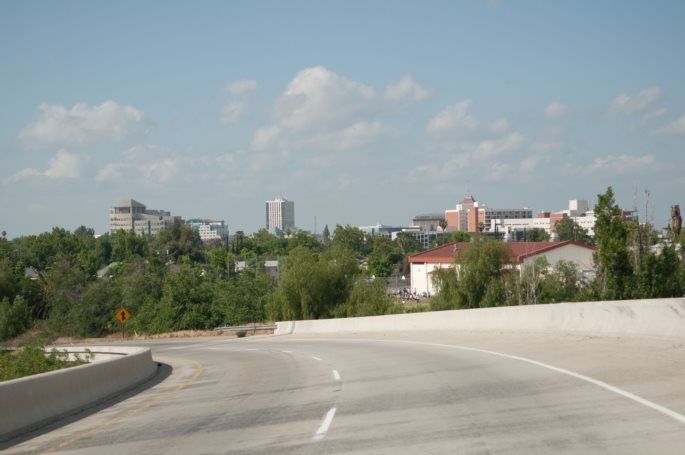
6. Fresno, CA
Large city · 500,000–999,999
Density (per sq mi)
4,725.4
Density change since 2020
+2.32%
Air quality note
Fresno–Madera ranked 3rd worst in the U.S. for year-round particle pollution in the American Lung Association's 2025 State of the Air report. The city faces a two-season air quality crisis: summer brings intense ozone from vehicle and agricultural emissions baking in the San Joaquin Valley heat — ozone drove 70% of monitored days in 2025 — while winter temperature inversions trap wood smoke and diesel PM2.5 from freight corridors at ground level for weeks at a time. Wildfire smoke from the Sierra Nevada adds hazardous spikes from July through October. Despite improvement over the past decade, Fresno remains one of the few U.S. cities where both ozone and particle pollution exceed federal standards year-round. A MERV 13 filter replaced every 45–60 days is the right choice for Fresno households. Shop MERV 13 filters →
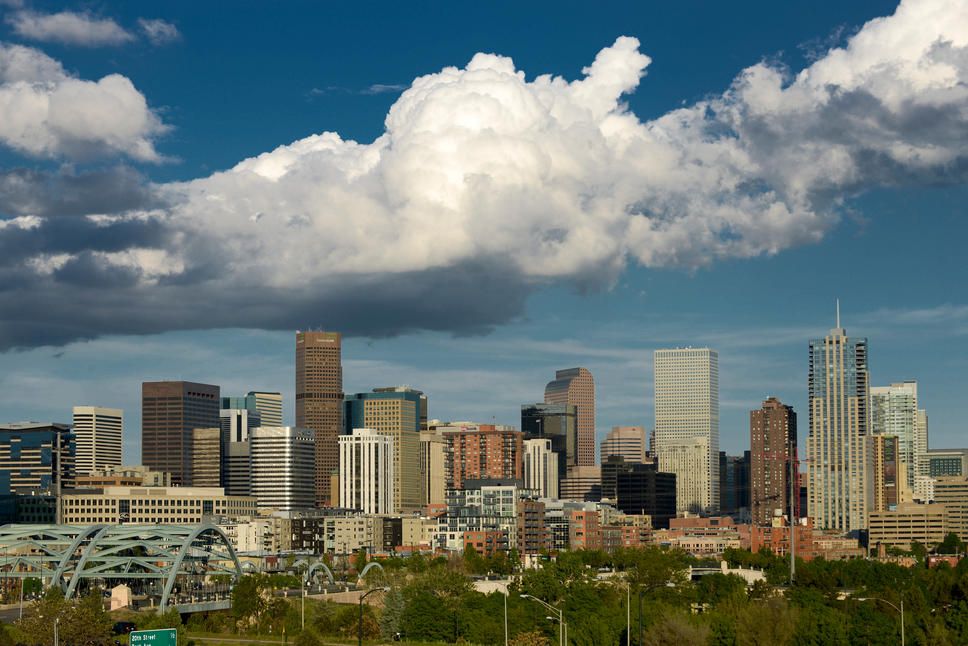
7. Denver–Aurora–Lakewood, CO
Metro area (MSA) · 10-County Front Range Region
Density (per sq mi)
355.2
2026 population
3,027,000
2020 population
2,963,821
Density change since 2020
+2.14%
Air quality note
Denver's Front Range holds one of the country's most stubborn ozone problems — rated "F" by the American Lung Association and classified as an extreme ozone non-attainment zone by the EPA, the highest severity level possible. Vehicle emissions and oil and gas operations — including the Suncor refinery in Commerce City — trap ozone precursors against the Rocky Mountain foothills, where summer heat drives photochemical smog. Winter brings a separate challenge: temperature inversions lock PM2.5 and wood smoke at ground level for days at a time. Wildfire smoke from Colorado's forests adds hazardous spikes each summer. A MERV 13 filter replaced every 60 days is the right choice for Front Range households year-round. Shop MERV 13 filters →

8. Pittsburgh, PA
Metro area (MSA) · 8-County Southwestern Pennsylvania
Density (per sq mi)
464.8
2026 population
2,390,000
2020 population
2,457,250
Density change since 2020
−2.74%
Air quality note
Pittsburgh ranked 12th worst in the U.S. for year-round particle pollution and 16th worst for daily PM2.5 spikes in the American Lung Association's 2025 State of the Air report — the worst record in the entire Mid-Atlantic region. Despite the steel industry's decline, the region's air quality is still shaped by natural gas production and the Shell cracker plant in Beaver County, Mon Valley coke works, diesel freight, and valley geography that traps inversions all winter. Allegheny County earned an "F" for year-round particle pollution in 2025. A MERV 13 filter replaced every 60 days is the right year-round choice for Pittsburgh households. Shop MERV 13 filters →
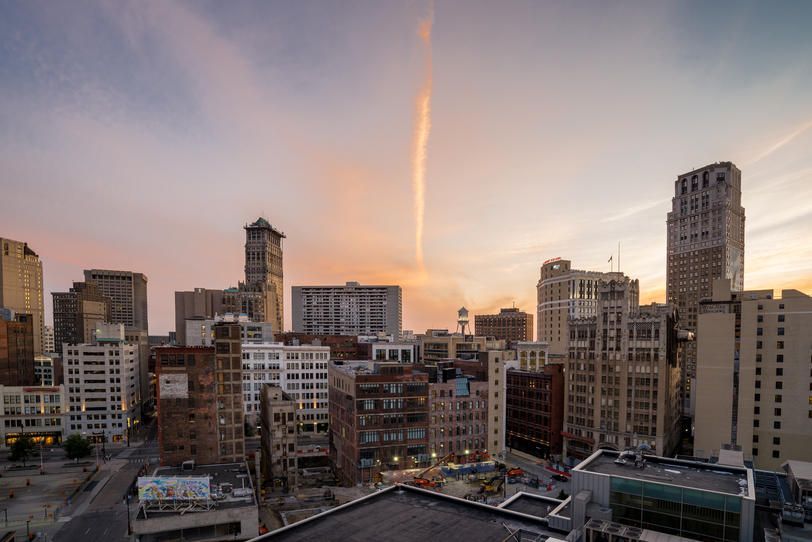
9. Detroit–Warren–Dearborn, MI
Metro area (MSA) · 6-County Southeastern Michigan
Density (per sq mi)
1,122.6
2026 population
4,375,000
2020 population
4,392,041
Density change since 2020
−0.39%
Air quality note
Detroit earned an "F" grade for both ozone and particle pollution in the ALA's 2026 State of the Air report, ranking 9th worst nationally for year-round PM2.5. The Motor City's air quality challenge is a convergence of the Southwest Detroit industrial corridor — the Marathon Oil refinery, US Steel's Zug Island, and the Ambassador Bridge freight corridor — with Great Lakes weather inversions that trap particulate matter at ground level for days. Canadian wildfire smoke increasingly spikes summer PM2.5 as well. Detroit also ranked #1 Asthma Capital in the U.S. on the 2025 Asthma Capitals report. A MERV 13 filter replaced every 45–60 days is the only appropriate choice for Metro Detroit households. Shop MERV 13 filters →
10. Chicago–Naperville–Elgin, IL-IN-WI
Metro area (MSA) · 13-County Tri-State Region
Density (per sq mi)
1,279.5
2026 population
9,390,000
2020 population
9,618,502
Density change since 2020
−2.38%
Air quality note
Chicago earned a grade B for overall air quality in 2025 per EPA monitoring data — a meaningful improvement from its historically poor record — though Cook County still earns an "F" for ozone from the American Lung Association. The metro's two main air quality threats are summer ozone from vehicle and industrial emissions (Lake Michigan inversions trap pollution in the urban core) and PM2.5 spikes from the industrial Southwest Side corridor and Canadian wildfire smoke drifting south each summer. The City of Chicago's Open Air monitoring network of 277 sensors shows significant neighborhood-level variation, with Pilsen and Calumet facing the heaviest industrial burden. A MERV 11 filter replaced every 60–90 days is the right year-round baseline — step up to MERV 13 during any wildfire smoke or high-ozone event. Shop MERV 11 filters →
Metros with the Best Air Quality
Methodology & Detailed Findings
The data used in this analysis is from the EPA’s 2019 Air Quality Index Report. The Air Quality Index (AQI) is EPA’s method for reporting daily air quality by location based on National Ambient Air Quality Standards. Higher AQI values correspond to higher levels of pollution and worse air quality. AQI values below 50 are considered good; AQI values between 51 and 100 are considered moderate; and AQI values that exceed 100 are considered unhealthy (at first for sensitive groups and then for everyone as values increase).
To determine the locations with the worst air quality, metropolitan areas were ranked by their respective median AQI values, with high AQI values corresponding to worse air quality. In the event of a tie, the location with the higher maximum AQI value was considered to have worse air quality.
Population data is from the U.S. Census Bureau’s 2018 American Community Survey 1-Year Estimates. Only metropolitan areas with at least 500,000 residents were included in the report.
