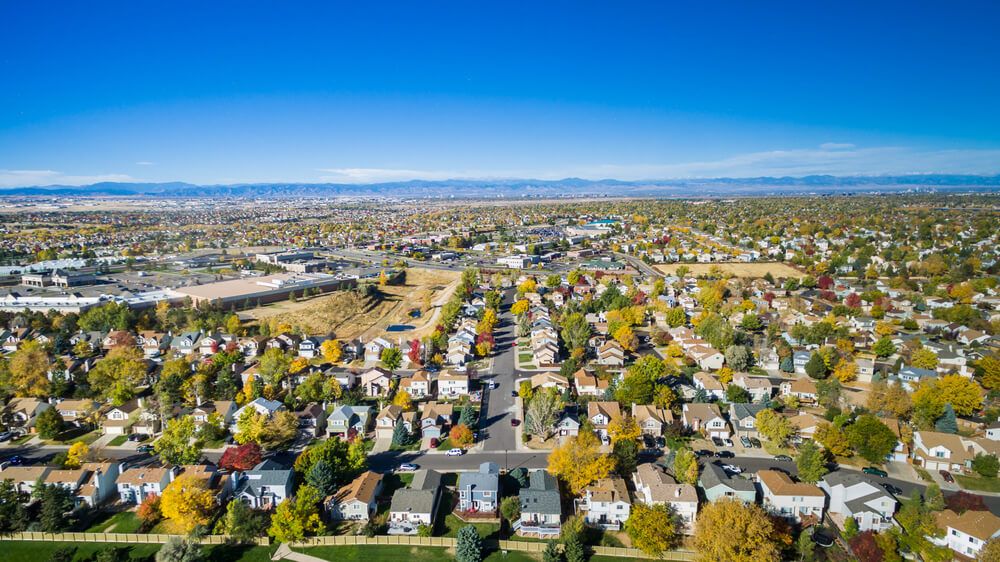
American cities couldn't be more different when it comes to how much space their residents have. New York City packs nearly 28,000 people into every square mile. Jacksonville, Florida — with a similar population — spreads that same number of people across an area 16 times larger. Those differences aren't just a curiosity. Population density shapes everything from housing costs and commute times to traffic levels, green space, and the air you breathe indoors and out.
To find out which large U.S. cities are the most and least densely populated, researchers at Filterbuy analyzed Census Bureau population and land area data for every American city with more than 100,000 residents. Here's what they found.
What this means for your air quality
Dense cities produce more traffic exhaust, industrial emissions, and airborne particulates than rural or suburban areas. The more densely packed the city, the harder your home's air filter has to work — and the more frequently it needs to be replaced.
See air quality rankings by city →
More than 80 percent of Americans now live in urban areas — a share that has climbed steadily as cities continue to attract jobs and investment that rural communities struggle to match. The COVID-19 pandemic briefly pushed some residents toward the suburbs, but that shift proved mostly temporary. The pull of city living remains as strong as ever.
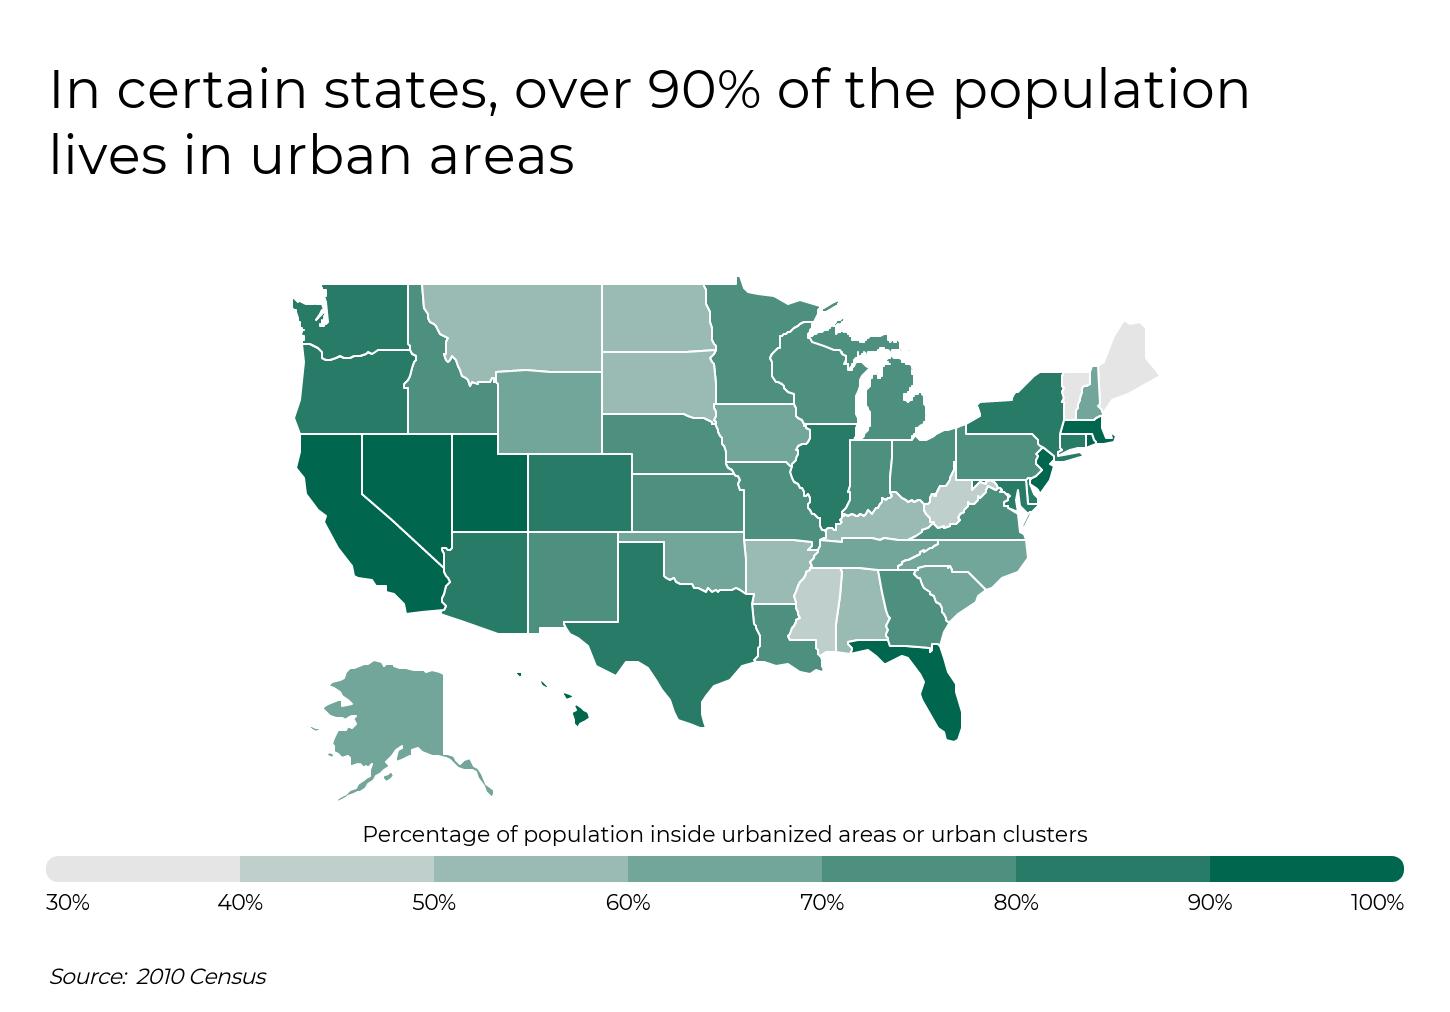
For now, urbanization remains the dominant characteristic in many parts of the country outside of New England, the Midwest, and parts of the South. In fact, nine states have more than 90 percent of their population living in urban areas, led by California at 95 percent. Across the country, only four states—Mississippi, West Virginia, Vermont, and Maine—have less than half of their population in urban areas.
Urban air quality & your filter
Residents of densely populated cities are exposed to higher concentrations of PM2.5 particles, ozone, and traffic-related pollutants. A quality MERV-rated filter captures these particles before they circulate through your home — but only if it's changed on the right schedule.
Low density area
Every 90 days
Suburbs, rural cities, low traffic
Mid density area
Every 60 days
Mid-size cities, moderate traffic
High density city
Every 30–45 days
NYC, SF, Boston, Chicago, Miami
Shop air filters by size →
Residents of densely populated cities often endure generally worse air quality composed of many unhealthy pollutants. If you live in an urban area, it’s important to replace your home air filters frequently.
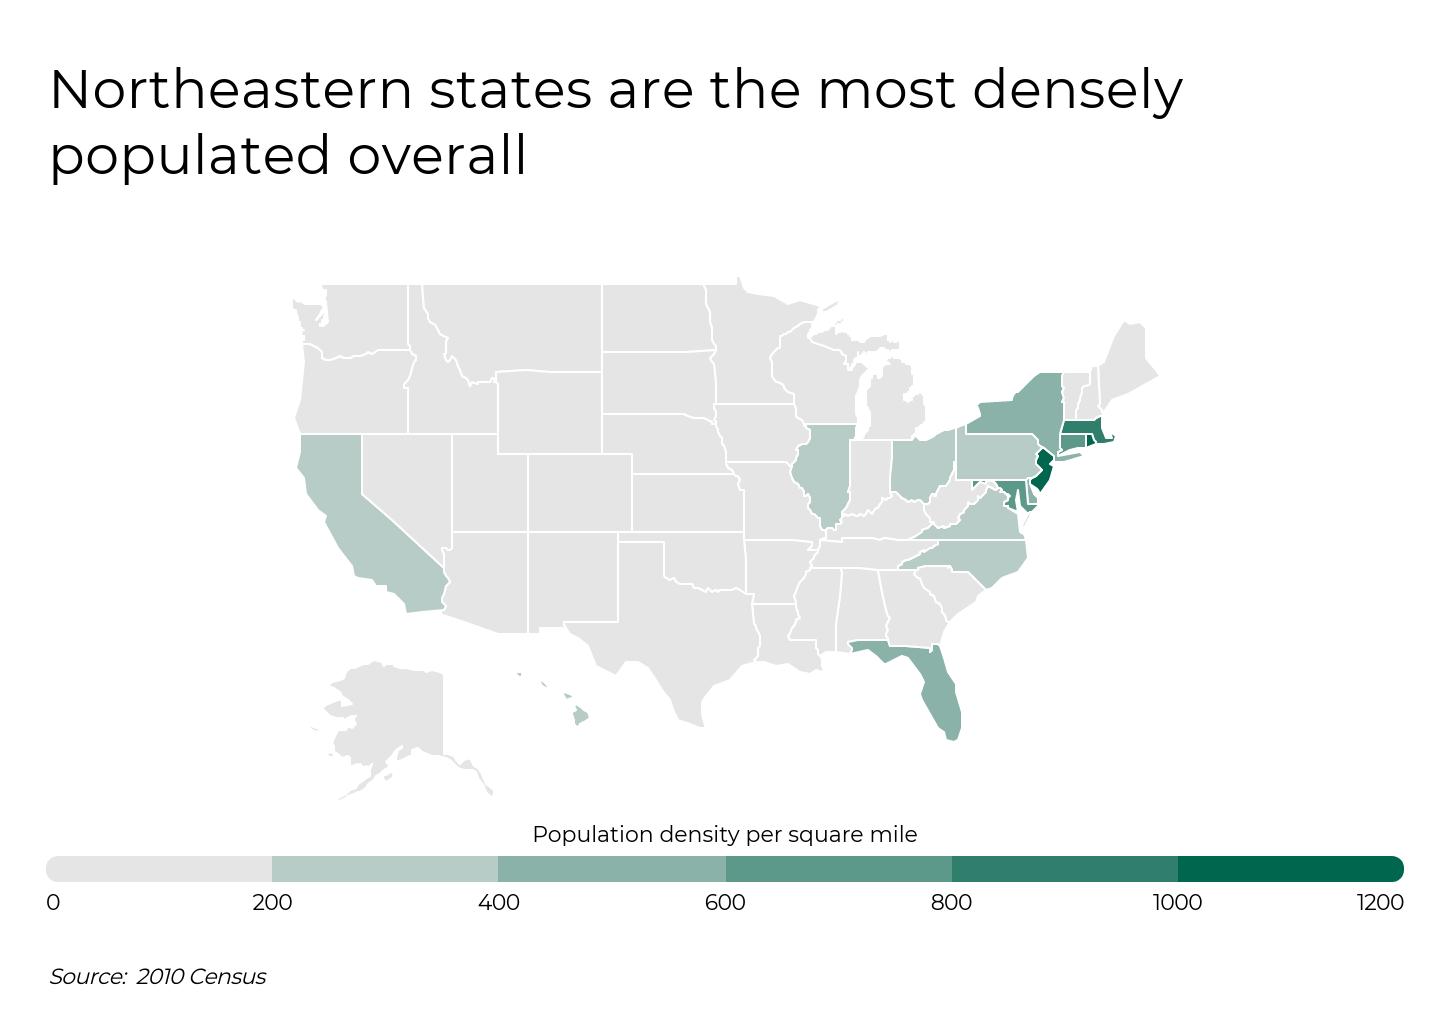

The densest states are clustered in the Mid-Atlantic and New England — New Jersey leads the nation at over 1,200 residents per square mile, a legacy of industrial-era urbanization that packed populations into a small geographic footprint. Sun Belt states like Florida, Texas, and Arizona are gaining ground fast as migration continues to reshape the map.
At the city level, density comes down to two factors: how many people live there, and how much land they're spread across. San Francisco and Jacksonville have nearly identical populations, but San Francisco's 47 square miles versus Jacksonville's 747 make them the second-most and second-least dense large cities in the country respectively.
Small cities · population 100,000–149,999
Source: U.S. Census Bureau, 2020 Census
Most densely populated
| Rank |
City |
Population |
Land area (sq mi) |
Density (per sq mi) |
| 1 | Paterson, NJ | 145,233 | 8.4 | 17,290 |
| 2 | Bridgeport, CT | 148,654 | 16.0 | 9,291 |
| 3 | Elizabeth, NJ | 137,298 | 12.3 | 11,162 |
| 4 | Hartford, CT | 121,054 | 17.3 | 6,997 |
| 5 | New Haven, CT | 134,023 | 18.9 | 7,092 |
Least densely populated
| Rank |
City |
Population |
Land area (sq mi) |
Density (per sq mi) |
| 1 | Anchorage, AK | 291,247 | 1,706.4 | 171 |
| 2 | Chesapeake, VA | 249,422 | 340.7 | 732 |
| 3 | Lexington, KY | 322,570 | 283.6 | 1,137 |
| 4 | Lubbock, TX | 258,862 | 152.0 | 1,703 |
| 5 | Colorado Springs, CO | 478,961 | 186.2 | 2,572 |
Midsize cities · population 150,000–349,999
Source: U.S. Census Bureau, 2020 Census
Most densely populated
| Rank |
City |
Population |
Land area (sq mi) |
Density (per sq mi) |
| 1 | Jersey City, NJ | 292,449 | 14.8 | 19,760 |
| 2 | Cambridge, MA | 118,403 | 6.4 | 18,520 |
| 3 | Somerville, MA | 81,360 | 4.1 | 19,660 |
| 4 | Newark, NJ | 311,549 | 24.1 | 12,927 |
| 5 | Hialeah, FL | 223,109 | 19.8 | 11,268 |
Least densely populated
| Rank |
City |
Population |
Land area (sq mi) |
Density (per sq mi) |
| 1 | Augusta, GA | 202,081 | 302.4 | 668 |
| 2 | Baton Rouge, LA | 227,470 | 176.2 | 1,291 |
| 3 | Winston-Salem, NC | 249,545 | 132.9 | 1,878 |
| 4 | Greensboro, NC | 299,035 | 130.7 | 2,288 |
| 5 | Laredo, TX | 255,473 | 106.2 | 2,405 |
Source: U.S. Census Bureau, 2020 Decennial Census. Population density calculated as total population divided by land area in square miles.
The Most Densely Populated Large Cities
New York, NY
Megacity · 1,000,000+
Density (per sq mi)
29,308.3
2026 population
8,509,853
2020 population
8,804,190
Density change since 2020
−3.34%
Air quality note
New York City's air is shaped by dense traffic, construction activity, harbor and airport emissions, and seasonal wildfire smoke drifting from Canada — most notably in June 2023 when AQI briefly exceeded 200. For most apartments, a MERV 11 filter changed every 60–90 days handles everyday urban particulates and pollen. Upgrade to MERV 13 if your system supports it for finer particles like smoke and city haze — particularly during summer ozone season. Shop MERV 11 →
San Francisco, CA
Large city · 500,000–999,999
Density (per sq mi)
18,652.0
Density change since 2020
−7.03%
Air quality note
San Francisco's coastal breezes keep baseline air quality relatively clean, but wildfire smoke is the city's dominant air quality threat — nearby California fires have spiked the AQI into "unhealthy" territory repeatedly, most severely during the 2018 Camp Fire. Vehicle traffic, port activity, and marine inversions that trap pollutants are ongoing contributors. A MERV 13 filter changed every 60–90 days is the recommended baseline — it captures the fine PM2.5 particles that wildfire smoke delivers, and the California Air Resources Board recommends MERV 13 or higher for smoke events specifically. Shop MERV 13 →
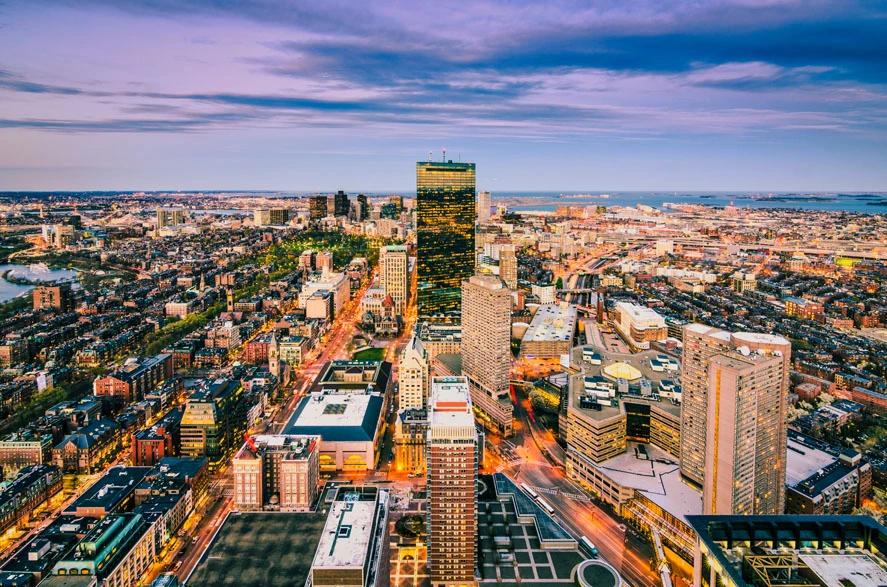
Boston, MA
Large city · 500,000–999,999
Density (per sq mi)
13,988.5
Density change since 2020
−0.48%
Air quality note
Boston's air quality is generally favorable compared to larger U.S. metros, but vehicle emissions and summer ground-level ozone are ongoing concerns — the American Lung Association has flagged the metro for ozone pollution in recent years. The city's six-month heating season means HVAC systems run continuously from October through April, loading filters faster than typical schedules account for. A MERV 11 filter is the recommended baseline for most Boston homes, changed every 60 days during heating season — upgrade to MERV 13 during any AQI event above 100. Shop MERV 11 →
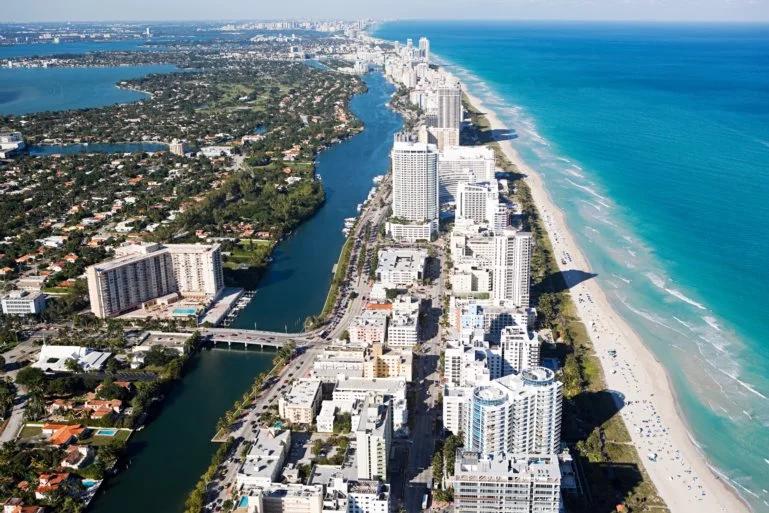
Miami, FL
Midsize city · 250,000–499,999
Density (per sq mi)
12,394.7
Density change since 2020
+4.46%
Air quality note
Miami's coastal geography — flanked by the Atlantic and the Gulf — helps disperse local emissions better than most major U.S. cities, and it has consistently met EPA standards for PM2.5 and ozone since 2009. That said, the Port of Miami's cruise ship traffic generates diesel exhaust equivalent to hundreds of thousands of idling trucks, and summer humidity creates conditions that worsen mold spore and pollen concentrations indoors. A MERV 11 filter changed every 60–90 days is the recommended baseline for most Miami homes — it handles fine dust, mold, and pollen without straining most HVAC systems in the year-round cooling climate. Shop MERV 11 →
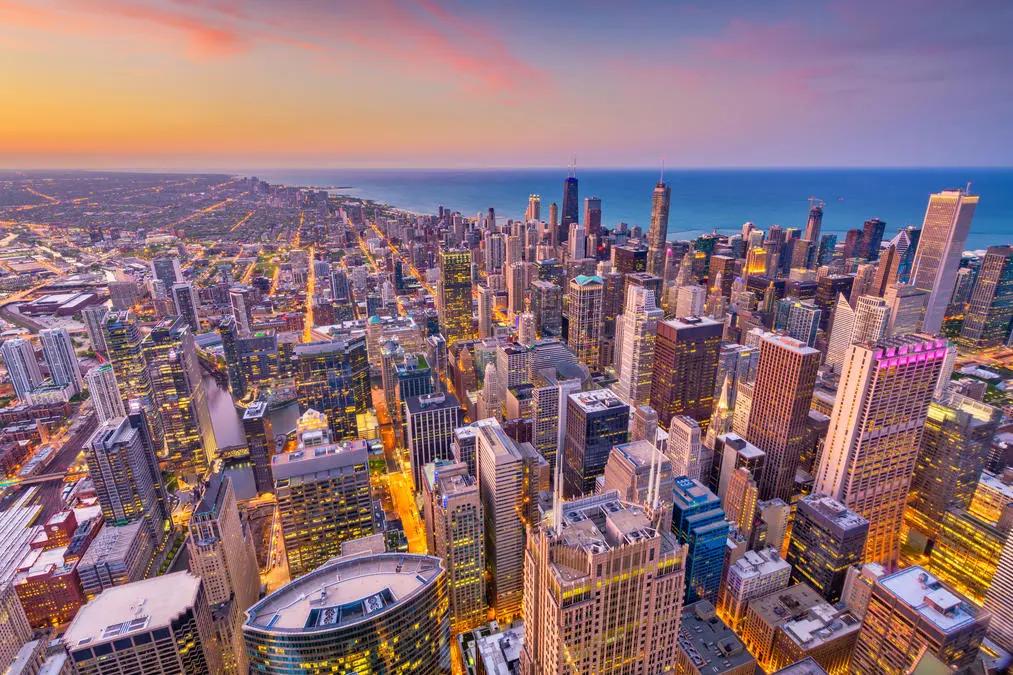
Chicago, IL
Major city · 1,000,000+
Density (per sq mi)
12,065.0
2026 population
2,709,364
2020 population
2,746,388
Density change since 2020
−1.35%
Air quality note
Chicago is one of the more challenging air quality environments in the Midwest — northeastern Illinois is in federal nonattainment for ozone, and PM2.5 levels from diesel transport, industrial emissions, and winter wood burning have historically exceeded both EPA and WHO annual targets. Lake Michigan's weather patterns drive temperature inversions that trap pollutants near ground level, especially in summer and winter. The American Lung Association ranks Chicago among the top 25 most polluted U.S. cities for both ozone and particulate matter. A MERV 13 filter changed every 60–90 days is the right baseline here — it targets the fine PM2.5 particles tied to Chicago's primary pollution sources. Shop MERV 13 →

Philadelphia, PA
Major city · 1,000,000+
Density (per sq mi)
11,952.7
2026 population
1,579,959
2020 population
1,603,797
Density change since 2020
−1.49%
Air quality note
Philadelphia's primary air quality concern is ground-level ozone — the Philadelphia-Reading-Camden metro area has ranked among the top 25 worst nationally for ozone pollution, worsened by rising temperatures and traffic emissions. While PM2.5 levels have improved steadily over recent years, agricultural ammonia from surrounding farmland reacts with urban pollutants to form secondary particulate matter each spring. The city's proximity to industrial corridors along the Delaware River adds to the mix. A MERV 11 filter is a solid daily baseline for most Philadelphia homes, changed every 60–90 days — upgrade to MERV 13 during high-ozone summer days or any AQI event above 100. Shop MERV 11 →
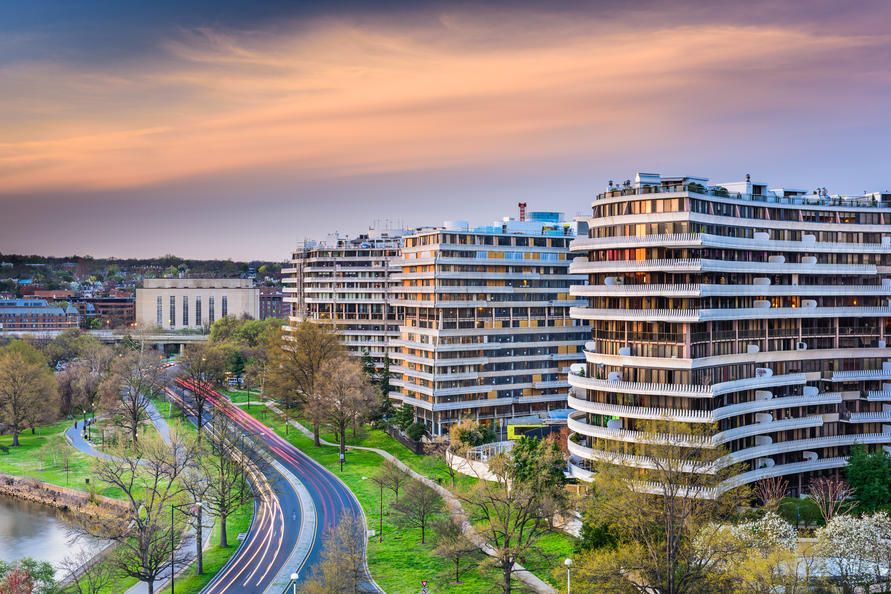
Washington, DC
Large city · 500,000–999,999
Density (per sq mi)
11,230.4
Density change since 2020
+4.11%
Air quality note
Washington, DC has earned an "F" rating for ozone pollution from the American Lung Association every year since tracking began — a persistent problem driven by vehicle traffic, with nearly half of all DC air pollution originating from mobile sources. While PM2.5 meets federal standards, winter wood-burning stoves and seasonal wildfire smoke from the west cause periodic spikes. The district's proximity to Maryland and Virginia means regional pollutants drift in regardless of local controls. A MERV 11 filter changed every 60–90 days handles the city's everyday particulate mix well — step up to MERV 13 during summer ozone season or high-AQI days. Shop MERV 11 →
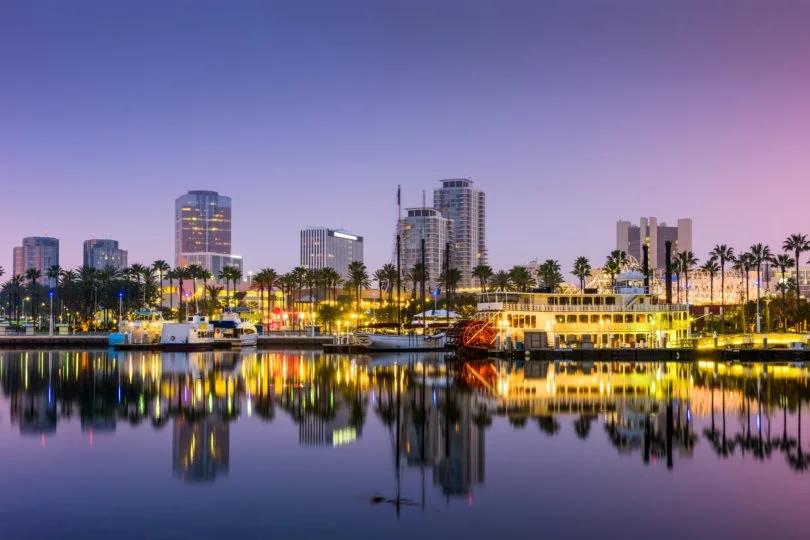
Long Beach, CA
Midsize city · 250,000–499,999
Density (per sq mi)
9,203.5
Density change since 2020
−3.33%
Air quality note
Long Beach sits at the intersection of two of the nation's most significant air quality challenges: the Port of Long Beach — the second busiest container port in the U.S. — pumps continuous diesel exhaust from ships, trucks, and freight equipment, while the broader Los Angeles-Long Beach metro ranks among the top five worst cities nationally for both PM2.5 and ozone. Wildfire smoke from California's interior adds seasonal spikes, with September and October historically the most polluted months. A MERV 13 filter changed every 60–90 days is the right baseline here — it targets the fine PM2.5 and diesel particulates that define Long Beach's air quality burden. Shop MERV 13 →
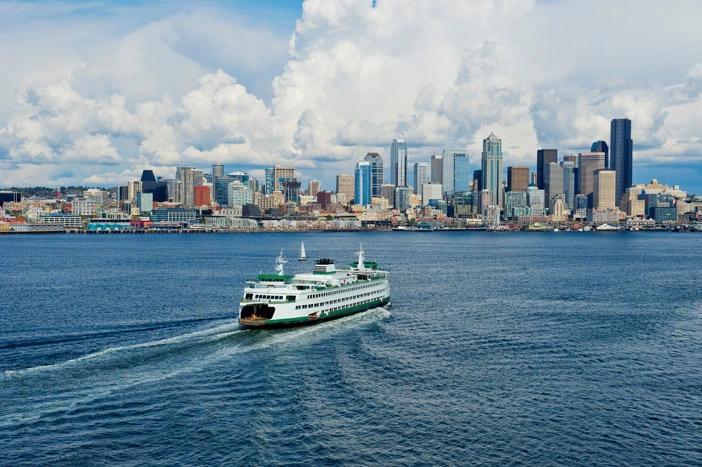
Seattle, WA
Large city · 500,000–999,999
Density (per sq mi)
8,774.0
Density change since 2020
+4.02%
Air quality note
Seattle's daily air quality is generally good year-round, benefiting from Pacific marine air that flushes out local emissions. The serious challenge is wildfire season — smoke from Eastern Washington, Oregon, and British Columbia regularly blankets the city from July through October, earning Seattle an "F" grade from the American Lung Association for 24-hour PM2.5 spikes. Winter wood-burning and temperature inversions add secondary PM2.5 spikes between December and February. A MERV 13 filter is the recommended baseline for Seattle homes — Filterbuy's own guidance for the Pacific Northwest lists it as the standard protection against wildfire smoke infiltration, not a premium upgrade. Change every 60–90 days, and stock spares before fire season. Shop MERV 13 →
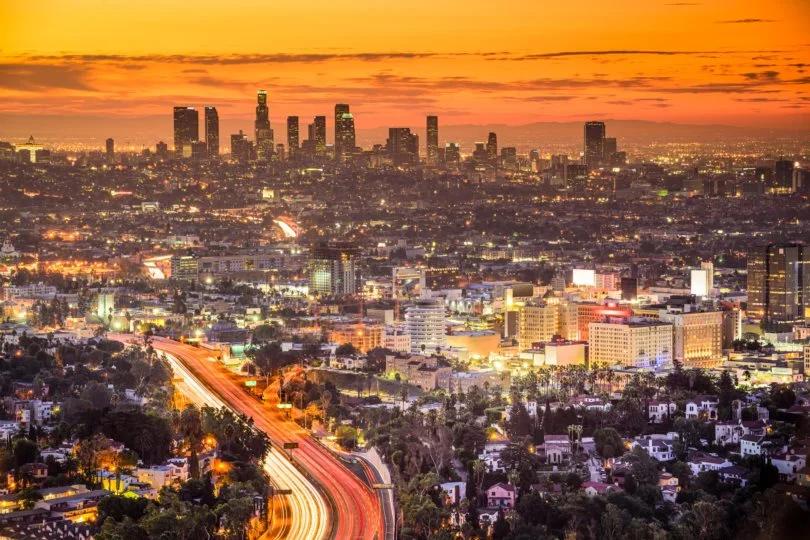
Los Angeles, CA
Megacity · 1,000,000+
Density (per sq mi)
8,304.0
2026 population
3,814,607
2020 population
3,898,747
Density change since 2020
−2.16%
Air quality note
Los Angeles has the worst ozone pollution of any major U.S. city, and the LA-Long Beach metro ranks in the top five nationally for PM2.5 as well. The city's geography — a coastal basin ringed by mountains — traps vehicle exhaust, port emissions, and wildfire smoke rather than allowing them to disperse. Santa Ana wind events and seasonal wildfires like the January 2025 fires, which drove downtown PM2.5 above 100 μg/m³, add dangerous acute spikes on top of chronic year-round smog. A MERV 13 filter changed every 60 days (more often during fire season) is the right baseline for all LA homes. Shop MERV 13 →
The Least Densely Populated Large Cities
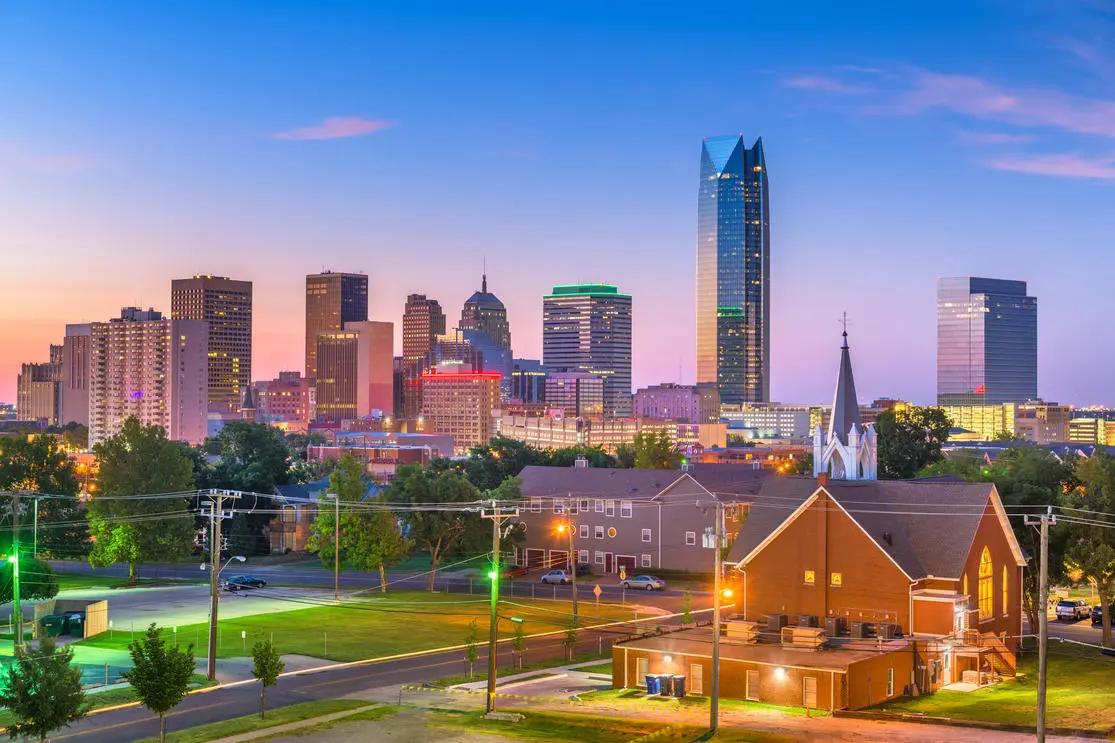
Oklahoma City, OK
Large city · 500,000–999,999
Density (per sq mi)
1,122.8
Density change since 2020
+6.87%
Air quality note
Oklahoma City has earned an "F" grade for ozone from the American Lung Association, ranking 43rd worst nationally. The city's long, hot summers — with around 145 days above 80°F and a March–November ozone season — create ideal conditions for photochemical smog. Wind-blown agricultural dust, prescribed burns in the surrounding tallgrass prairie, and oil and gas industry emissions add year-round PM2.5 load on top of vehicle exhaust. A MERV 8 filter changed every 60–90 days handles the baseline dust and pollen load well for most OKC homes — upgrade to MERV 11 during summer ozone season or any wildfire smoke event. Shop MERV 8 →
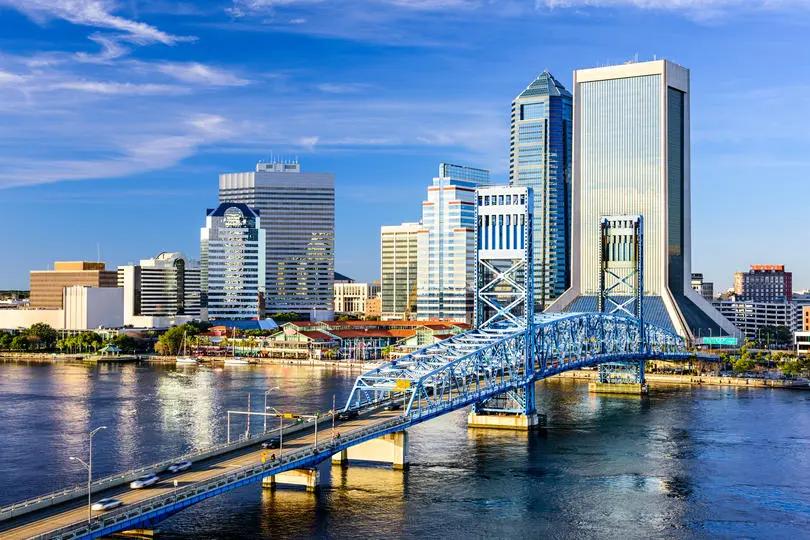
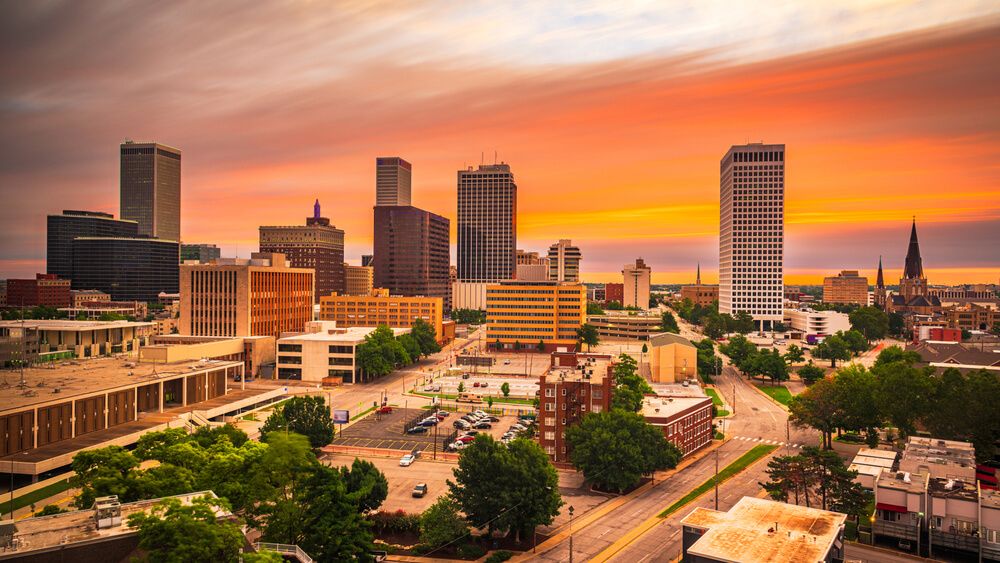
Jacksonville, FL
Major city · 1,000,000+
Density (per sq mi)
1,253.2
2026 population
1,015,967
Density change since 2020
+6.99%
Air quality note
Jacksonville earns an "A" grade for ozone — one of the cleanest major cities in the nation on that measure — but PM2.5 is the ongoing concern, driven by port diesel from the largest container port in Florida, military base traffic, and wildfire smoke drifting in from Georgia during spring and summer burn seasons. Jacksonville's signature challenge is its humid subtropical climate: around 196 days a year above 80°F keep particles suspended indoors far longer than drier cities, and HVAC systems run virtually year-round, loading filters faster. A MERV 11 filter changed every 60 days (more frequently during summer months) is the right baseline for most Jacksonville homes. Shop MERV 11 →
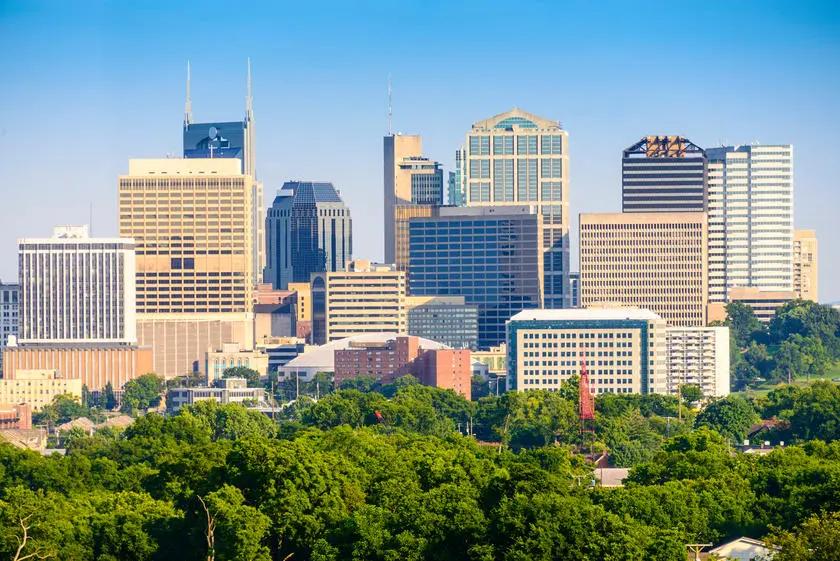
Nashville, TN
Large city · 500,000–999,999
Density (per sq mi)
1,368.0
Density change since 2020
+3.35%
Air quality note
Nashville currently meets EPA standards for both ozone and PM2.5 — a significant improvement from as recently as 2013 — but both measures hover near the federal threshold as the city's rapid growth adds vehicle and construction emissions. Air quality is distinctly seasonal: summer brings ozone from traffic and stagnant heat in the Cumberland valley, while winter sees PM2.5 spikes from wood burning and cold air inversions trapping pollutants near the ground. Davidson County has also been cited for failing state particle pollution benchmarks in some recent reporting periods. A MERV 8 filter changed every 60–90 days is a solid baseline for most Nashville homes — upgrade to MERV 11 during summer ozone season or any high-AQI event. Shop MERV 8 →
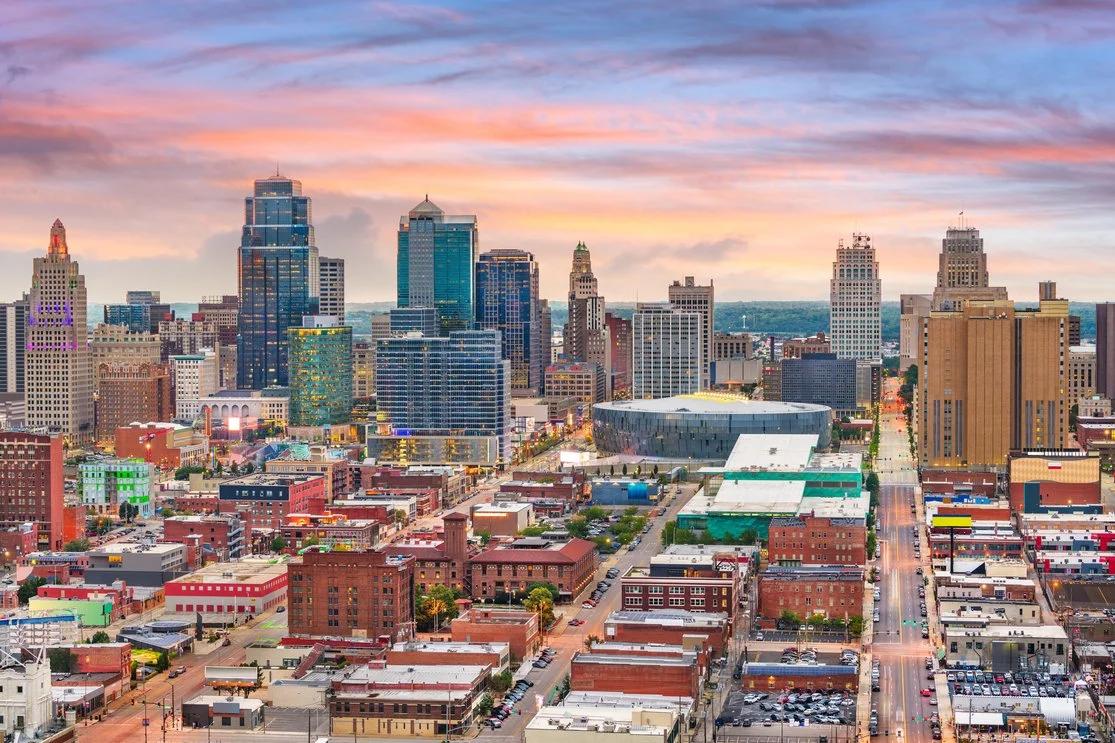
Kansas City, MO
Large city · 500,000–999,999
Density (per sq mi)
1,613.2
Density change since 2020
+2.50%
Air quality note
Kansas City's air quality is among the better performers in this series — PM2.5 averaged just 7.2 μg/m³ in 2020, well within WHO targets, earning a Clean Air Score of B. The primary concern is a well-defined ozone season running March through October, with June–August seeing the most exceedances; vehicle emissions and industrial sources in the bi-state airshed drive summer smog. Winter brings mild PM2.5 upticks from wood-burning and cold air inversions. A MERV 8 filter changed every 60–90 days is the right baseline for most Kansas City homes — upgrade to MERV 11 during summer ozone season or on wildfire smoke days. Shop MERV 8 →
Virginia Beach, VA
Midsize city · 250,000–499,999
Density (per sq mi)
1,845.3
Density change since 2020
−0.14%
Air quality note
Virginia Beach is among the cleanest major cities in this series — the Virginia Beach-Norfolk metro has ranked among the five cleanest U.S. metros for short-term particle pollution for ten consecutive years per the American Lung Association, with zero ozone exceedances in recent reporting periods. The Atlantic Ocean and Chesapeake Bay breezes continuously flush the airshed, and the city's low industrial density keeps PM2.5 consistently below WHO annual targets. The primary seasonal concern is summer ozone from vehicle emissions, peaking April through September. A MERV 8 filter changed every 90 days is a solid baseline for most Virginia Beach homes — the coastal air quality here is genuinely favorable. Shop MERV 8 →
Tulsa, OK
Midsize city · 250,000–499,999
Density (per sq mi)
2,263.0
Density change since 2020
+1.32%
Air quality note
Tulsa sits in a low-density corridor where urban sprawl meets Oklahoma's plains. Vehicle emissions and regional wildfire smoke are the primary air quality concerns — ozone season runs May through September with the worst days in June–August, amplified by the heat and the energy industry's VOC emissions. Tulsa has recorded up to 10 "unhealthy for sensitive groups" ozone days in recent years. Wildfire smoke from western states increasingly drives the city's worst PM2.5 spikes. A MERV 8 filter changed every 60–90 days is a solid baseline for most homes here — step up to MERV 11 during ozone season or any wildfire smoke event. Shop MERV 8 →
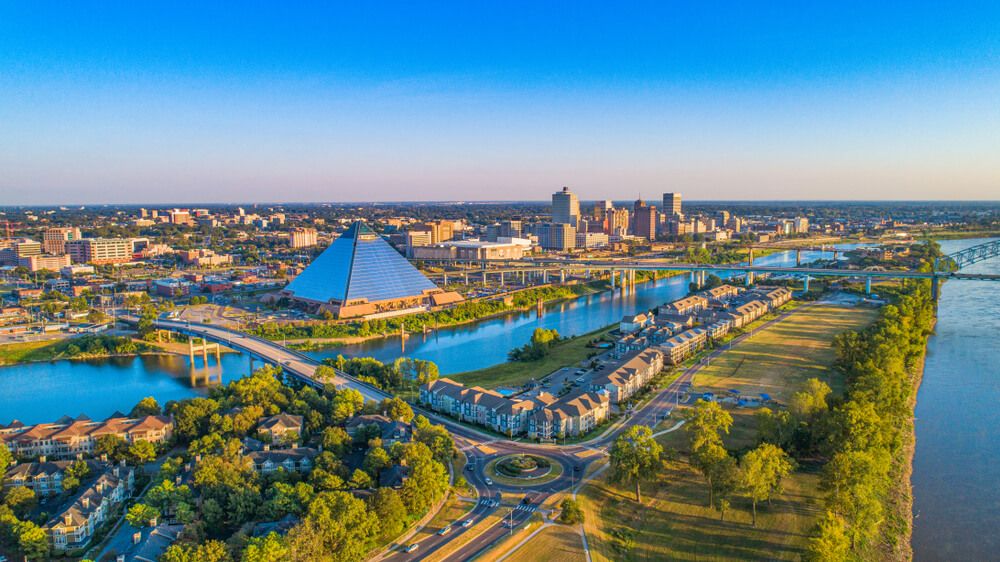
Memphis, TN
Large city · 500,000–999,999
Density (per sq mi)
2,009.2
Density change since 2020
−4.21%
Air quality note
Memphis ranks in the worst 25% of U.S. metros for ozone and earned a Clean Air Score of D — driven by heavy vehicle traffic on I-40/I-240, the FedEx superhub at Memphis International Airport operating 24/7 diesel trucks, and industrial point sources in Southwest Memphis including steel and chemical plants. The city is on the cusp of EPA ozone non-attainment. PM2.5 tracks below the EPA annual standard most years but has trended worse since 2019. A MERV 11 filter changed every 60–90 days is the right baseline for Memphis homes — it provides meaningful protection against the city's persistent PM2.5 and ozone-season particulates. Shop MERV 11 →
Tucson, AZ
Large city · 500,000–999,999
Density (per sq mi)
2,240.6
Density change since 2020
+1.24%
Air quality note
Tucson faces three distinct air quality threats that arrive in the same summer window: haboob dust storms drive PM10 to some of the highest concentrations in the country and can shift the AQI by 200 points in an hour; wildfire smoke from the Mogollon Rim and surrounding ranges pushes PM2.5 into unhealthy ranges during the dry pre-monsoon season; and summer heat drives ozone formation through the hottest months. Pima County holds EPA non-attainment status for PM10 in the Rillito corridor. PM2.5 annual averages remain below the EPA standard (~6 µg/m³ in 2024), but AQI is "good" fewer than one in three days. A MERV 11 filter changed every 60 days is the right baseline — step up to MERV 13 during wildfire smoke events or haboob season. Shop MERV 11 →
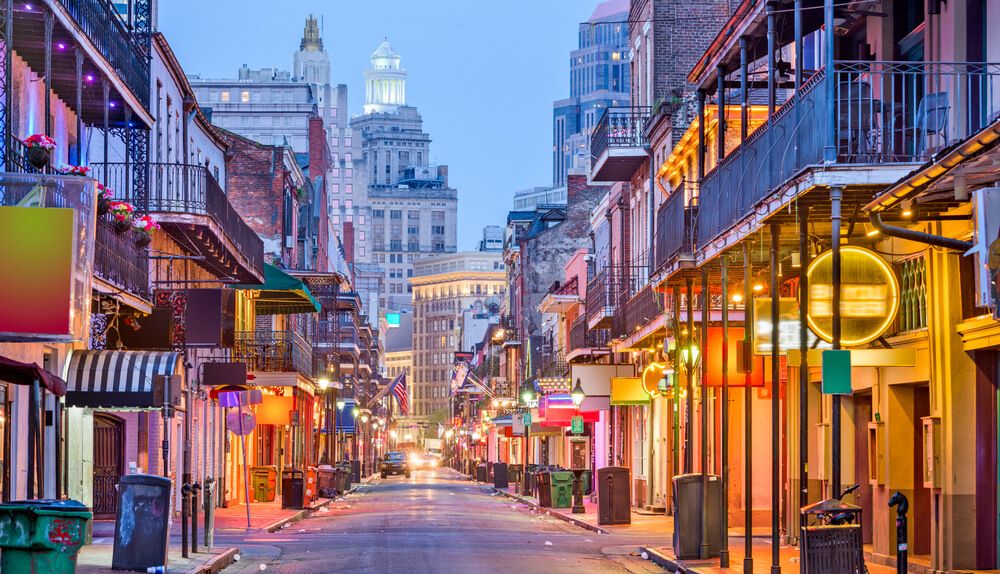
New Orleans, LA
Midsize city · 250,000–499,999
Density (per sq mi)
2,267.0
Density change since 2020
−5.04%
Air quality note
New Orleans faces a compounding air quality challenge rooted in its geography. The Port of New Orleans — one of the world's busiest — generates persistent diesel PM2.5 and sulfur dioxide from ship exhaust. Upriver along Louisiana's "Cancer Alley," oil refining and petrochemical plants add ozone precursors that drift into the city. New Orleans tied for 93rd most ozone-polluted U.S. city in the most recent American Lung Association report, with ozone driven by high heat and stagnant Gulf air. On top of this, extreme subtropical humidity keeps indoor pollutants and mold spores suspended in HVAC systems year-round — a pattern similar to Jacksonville. A MERV 11 filter changed every 60 days is the right baseline for New Orleans homes. Shop MERV 11 →
Aurora, CO
Midsize city · 250,000–499,999
Density (per sq mi)
2,354.0
Density change since 2020
+4.92%
Air quality note
Aurora sits on Denver's Front Range, one of the most ozone-challenged regions in the country — the American Lung Association rates Denver-Aurora an "F" for ozone, with roughly one in three days posing health risks. Hot summers and trapped mountain air create ideal ozone conditions, while winter temperature inversions lock vehicle and industrial exhaust near the ground. Wildfire smoke from the Rockies and western states layers PM2.5 on top throughout summer months. New oil and gas fracking operations in Aurora itself add ozone precursors directly within city limits. Both FilterBuy and CDPHE recommend MERV 13 for Front Range households — the triple threat of summer ozone, wildfire smoke, and winter inversions demands the highest practical residential filter rating. Shop MERV 13 →

Methodology & Detailed Findings
Population statistics are from the U.S. Census Bureau American Community Survey 1-Year Estimates. Land areas for each city are from the U.S. Census Bureau’s TIGERweb data.
To identify the most and least densely populated locations, researchers divided the total 2019 population by the 2019 land area in square miles. Researchers also calculated the percentage change in population density comparing 2019 population and land area to 2010 population and land area. In most cases, changes in population density were the result of changes in population between the two time periods; however, the land area of certain locations also changed significantly since 2010.
Only cities with at least 100,000 people in 2019 were included in the analysis. Additionally, cities were grouped into cohorts based on population: small (100,000–149,999), midsize (150,000–349,999), and large (350,000 or more).
