

Photo Credit: Alamy Stock Photo
By David Heacock
When it comes to buying a newly-built home, demand far outpaces supply. A survey from the National Association of Home Builders (NAHB) found that in 2018, 31 percent of home buyers wanted to purchase a brand-new home. Another report by NAHB found that 41 percent of millennial home buyers would prefer to own a brand-new home.
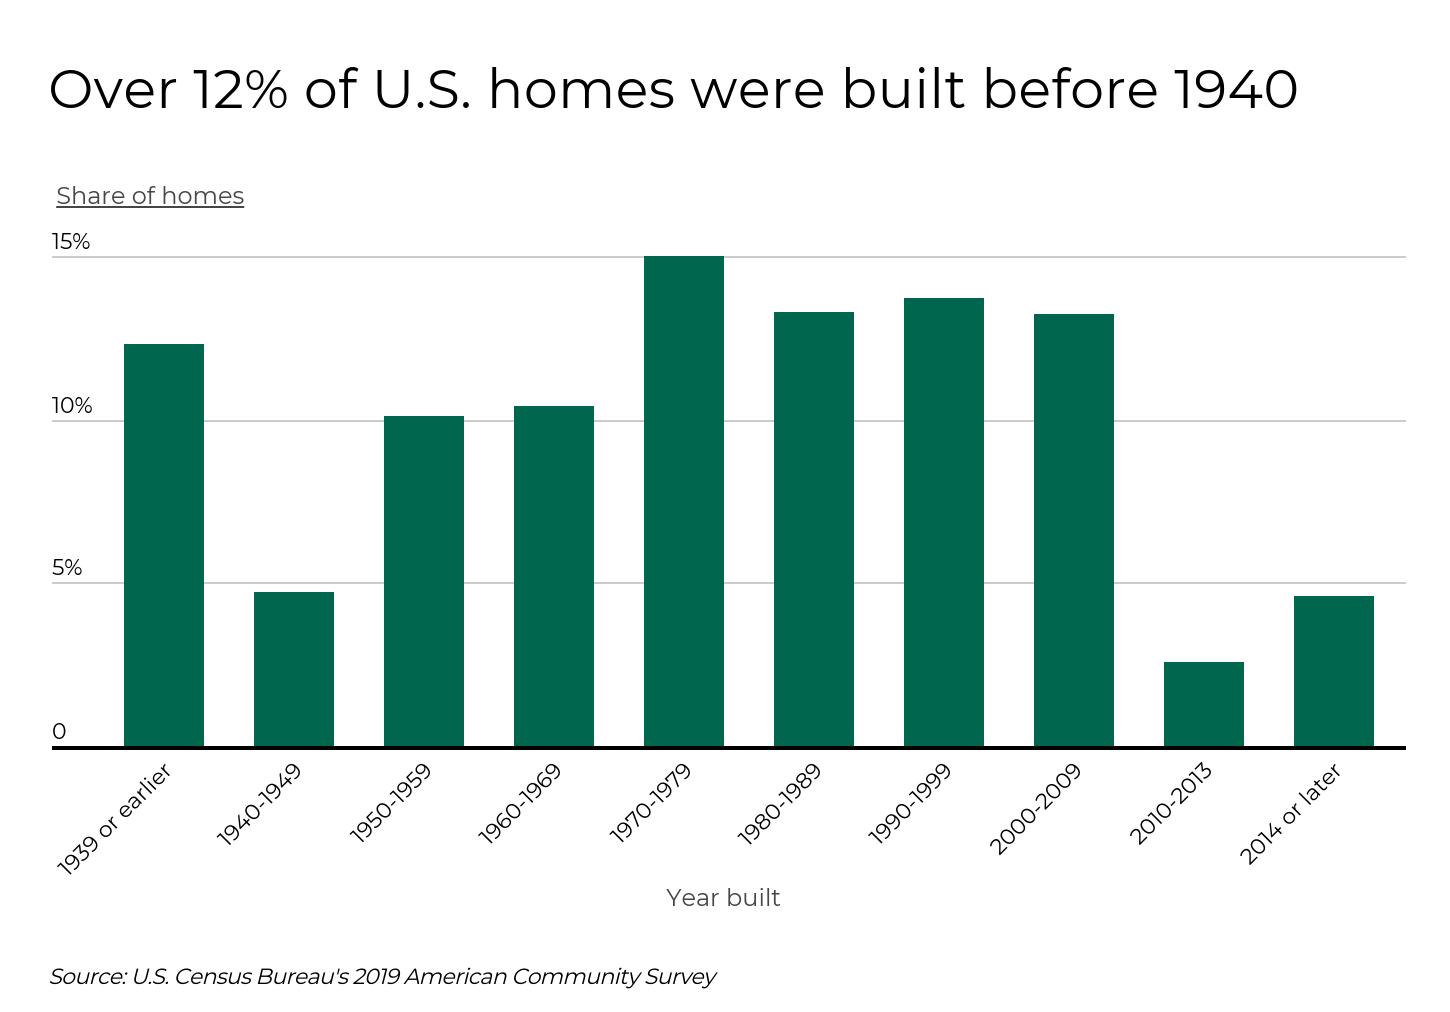
Despite many buyers’ preference for new homes, only about 11 percent of home sales each year are for new construction. The rest are for existing homes, many of which were built decades ago. In fact, U.S. Census Bureau data shows that 12.3 percent of homes in the U.S. were built before 1940, while only 4.6 percent were built in the past 5 years.
Older homes have their pros and cons. According to research from the National Association of Realtors, many buyers who purchase existing homes appreciate their charm and character, and others believe that these homes offer lower prices or better value. On the other hand, older homes also may be more expensive to own due to structural issues, outdated systems, and cosmetics, as well as the presence of hazardous materials. Materials, like asbestos, lead-based paint, and radon were once common building materials; however, these materials are now known to be hazardous to human health. In fact, the Environmental Protection Agency states that exposure to asbestos increases the risk of developing lung disease such as lung cancer. Additionally, mold and volatile organic compounds (VOCs) from remodeling activities are more common in older homes.
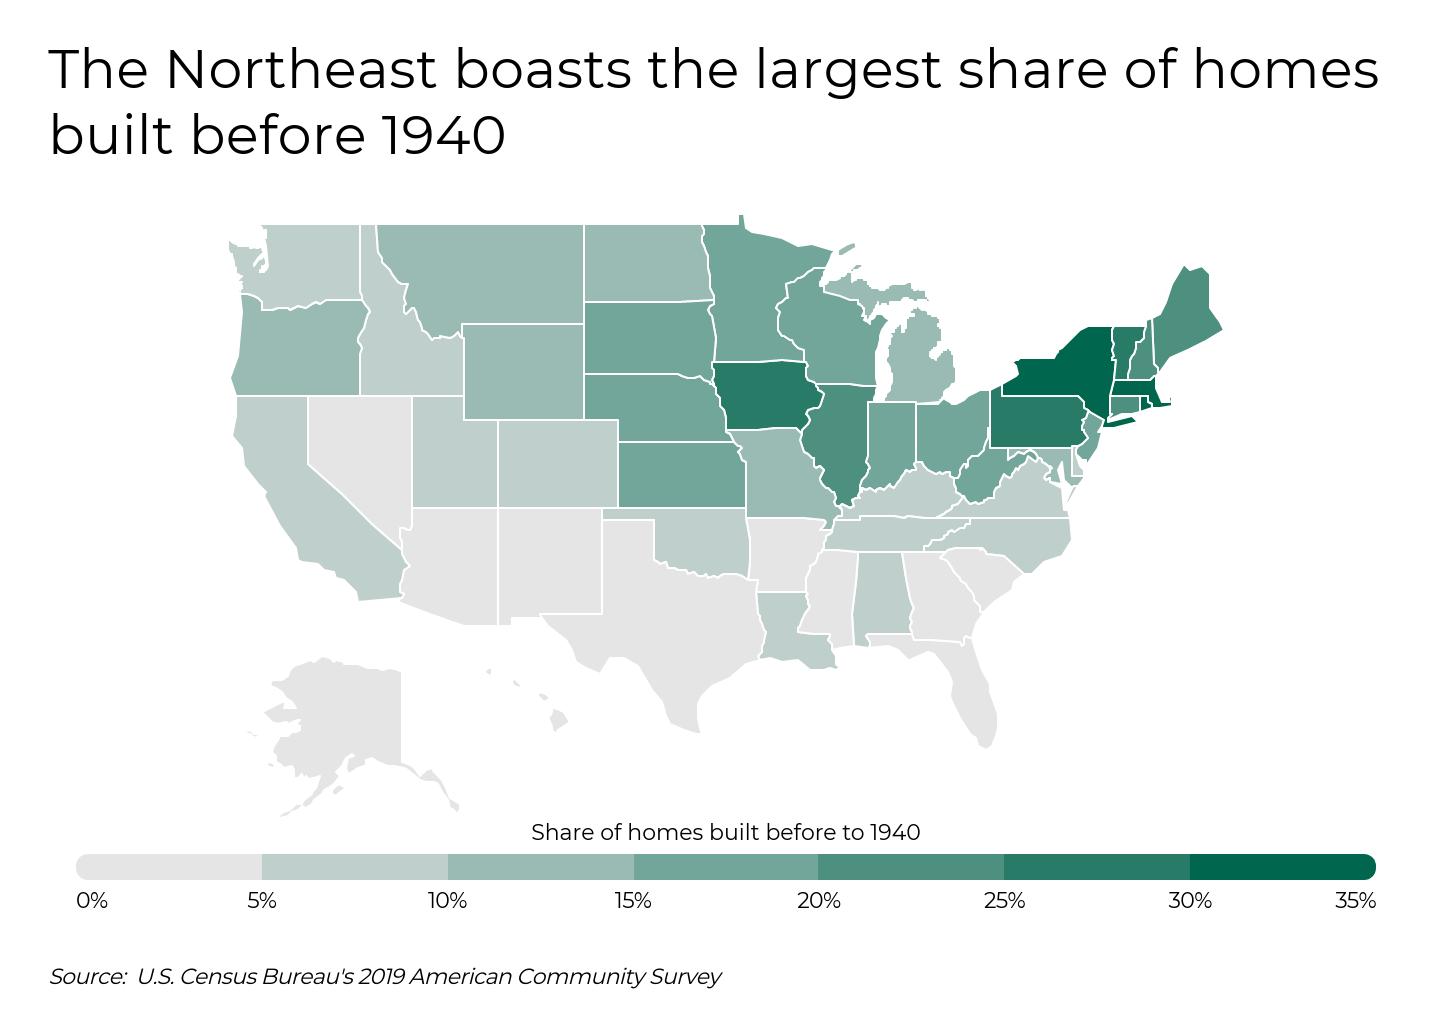
Not surprisingly, some parts of the country are more likely to have older homes than others. States with the most old homes are located in the Northeast. More specifically, more than 30 percent of homes in Massachusetts, New York, and Rhode Island were built before 1940. By contrast, states in the South and the West have a significantly smaller share of older homes—fewer than 2 percent of homes in Alaska, Arizona, and Nevada were constructed before 1940.
At the city level there is significantly more geographic variation in which places have the most old homes. To find which cities have the highest percentage of homes built before 1940, researchers at Filterbuy analyzed housing data from the U.S. Census Bureau’s 2019 American Community Survey 1-Year Estimates. Researchers also analyzed each city’s percentage of homes built after 2010, as well as the city’s median home price based on the Zillow Home Value Index. For reference, the median price for a home in the U.S. is $256,663.
Cities were categorized into groups based on population size: small (100,000–149,999), midsize (150,000–349,999), and large (350,000 or more). Here are the cities with the oldest homes.
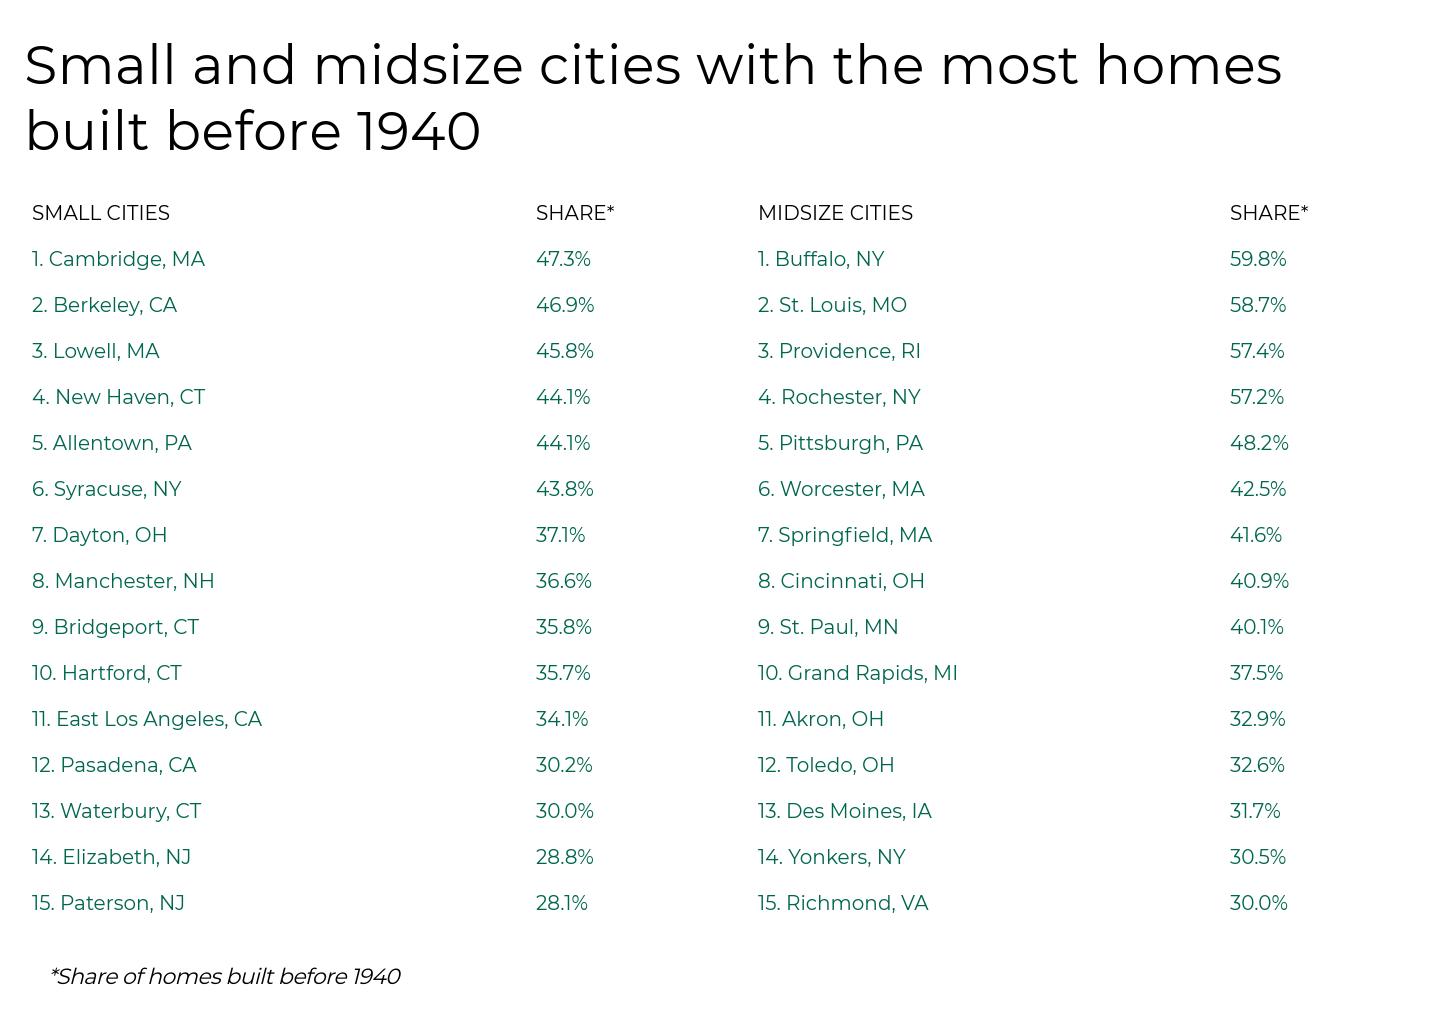
Photo Credit: Alamy Stock Photo
15. Seattle, WA
Share of homes built before 1940: 23.7%
Number of homes built before 1940: 88,091
Share of homes built in 2010 or later: 15.7%
Number of homes built in 2010 or later: 58,338
Median home price: $780,126
Related
Keep your historic home feeling fresh by replacing your home air filters regularly. Consider purchasing MERV 13 air filters for the highest level of protection inside your home.
14. Portland, OR
Share of homes built before 1940: 27.6%
Number of homes built before 1940: 82,428
Share of homes built in 2010 or later: 7.2%
Number of homes built in 2010 or later: 21,377
Median home price: $478,498

Photo Credit: Alamy Stock Photo
13. New Orleans, LA
Share of homes built before 1940: 32.2%
Number of homes built before 1940: 61,959
Share of homes built in 2010 or later: 4.2%
Number of homes built in 2010 or later: 8,011
Median home price: $234,036

Photo Credit: Alamy Stock Photo
12. Detroit, MI
Share of homes built before 1940: 32.7%
Number of homes built before 1940: 117,572
Share of homes built in 2010 or later: 1.1%
Number of homes built in 2010 or later: 3,906
Median home price: $38,721
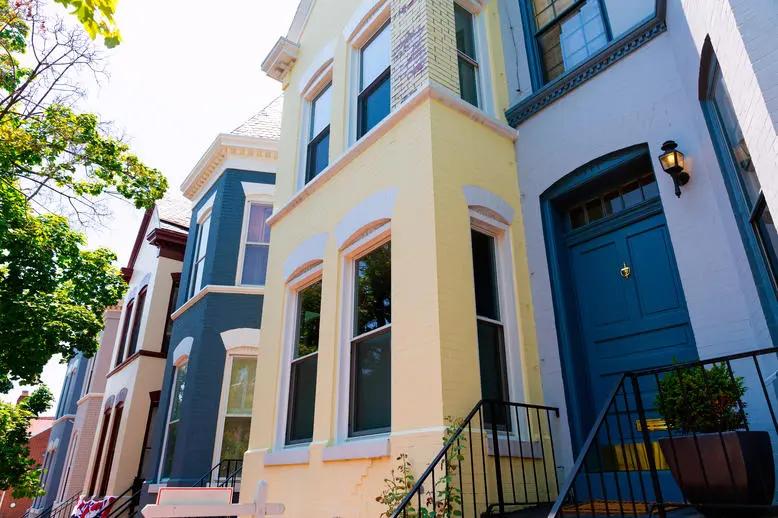
Photo Credit: Alamy Stock Photo
11. Washington, DC
Share of homes built before 1940: 32.8%
Number of homes built before 1940: 105,898
Share of homes built in 2010 or later: 10.3%
Number of homes built in 2010 or later: 33,097
Median home price: $636,247

Photo Credit: Alamy Stock Photo
10. Oakland, CA
Share of homes built before 1940: 35.8%
Number of homes built before 1940: 65,364
Share of homes built in 2010 or later: 2.0%
Number of homes built in 2010 or later: 3,582
Median home price: $805,743

Photo Credit: Alamy Stock Photo
9. Milwaukee, WI
Share of homes built before 1940: 36.7%
Number of homes built before 1940: 95,525
Share of homes built in 2010 or later: 2.2%
Number of homes built in 2010 or later: 5,702
Median home price: $141,450
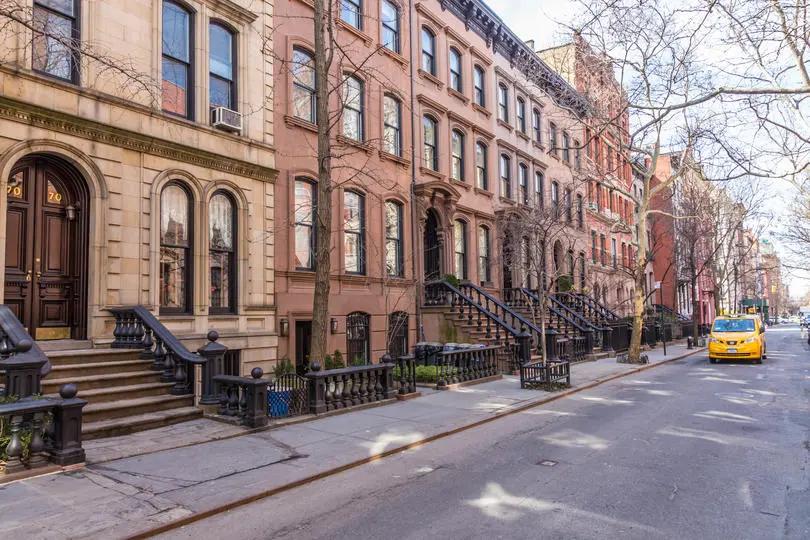
Photo Credit: Alamy Stock Photo
8. New York, NY
Share of homes built before 1940: 39.0%
Number of homes built before 1940: 1,383,287
Share of homes built in 2010 or later: 4.0%
Number of homes built in 2010 or later: 141,024
Median home price: $654,683
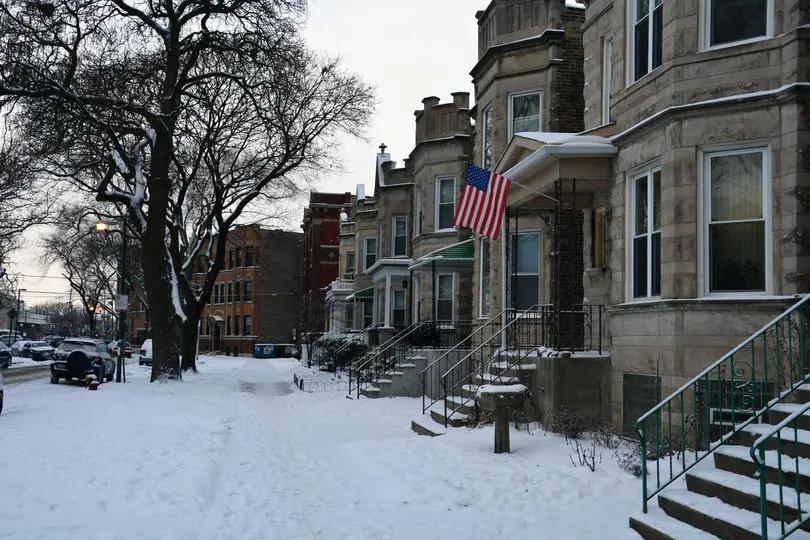
Photo Credit: Alamy Stock Photo
7. Chicago, IL
Share of homes built before 1940: 40.4%
Number of homes built before 1940: 492,213
Share of homes built in 2010 or later: 4.1%
Number of homes built in 2010 or later: 49,375
Median home price: $256,191
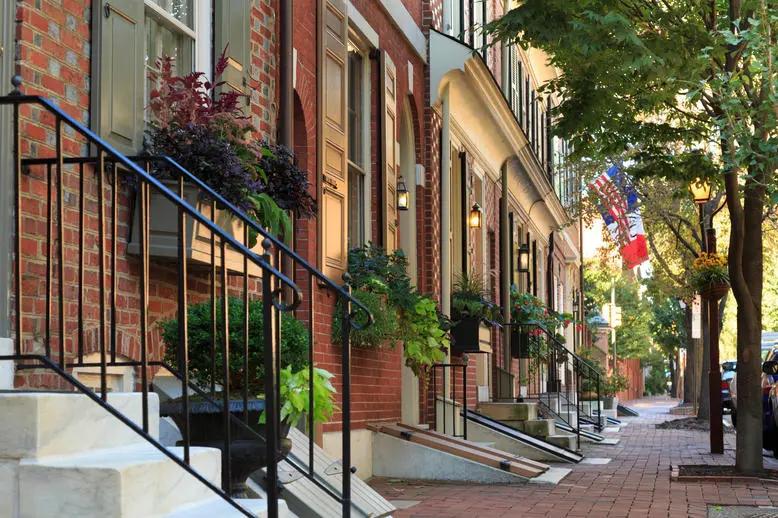
Photo Credit: Alamy Stock Photo
6. Philadelphia, PA
Share of homes built before 1940: 41.2%
Number of homes built before 1940: 285,003
Share of homes built in 2010 or later: 4.0%
Number of homes built in 2010 or later: 27,557
Median home price: $192,542

Photo Credit: Alamy Stock Photo
5. Baltimore, MD
Share of homes built before 1940: 42.0%
Number of homes built before 1940: 123,352
Share of homes built in 2010 or later: 3.7%
Number of homes built in 2010 or later: 10,904
Median home price: $154,813

Photo Credit: Alamy Stock Photo
4. Minneapolis, MN
Share of homes built before 1940: 43.8%
Number of homes built before 1940: 84,419
Share of homes built in 2010 or later: 7.2%
Number of homes built in 2010 or later: 13,931
Median home price: $303,793
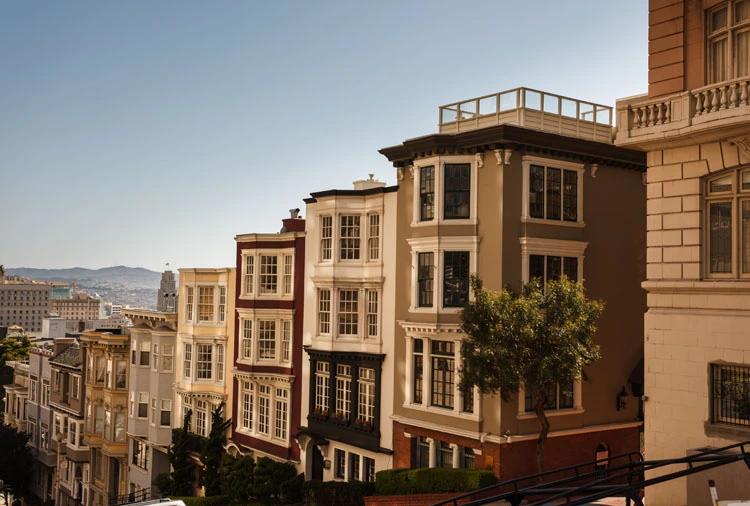
Photo Credit: Alamy Stock Photo
3. San Francisco, CA
Share of homes built before 1940: 45.1%
Number of homes built before 1940: 183,323
Share of homes built in 2010 or later: 5.4%
Number of homes built in 2010 or later: 21,940
Median home price: $1,416,879
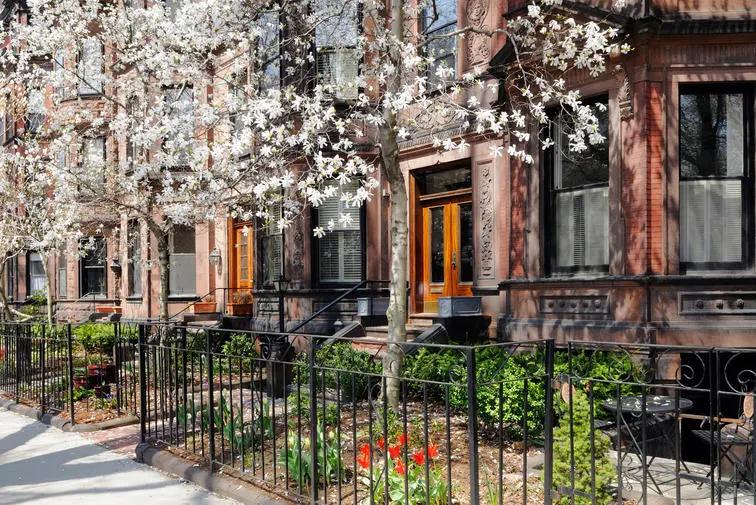
Photo Credit: Alamy Stock Photo
2. Boston, MA
Share of homes built before 1940: 48.2%
Number of homes built before 1940: 146,449
Share of homes built in 2010 or later: 7.2%
Number of homes built in 2010 or later: 21,916
Median home price: $653,078

Photo Credit: Alamy Stock Photo
1. Cleveland, OH
Share of homes built before 1940: 52.4%
Number of homes built before 1940: 108,943
Share of homes built in 2010 or later: 2.6%
Number of homes built in 2010 or later: 5,439
Median home price: $74,946
To identify locations with the largest share of homes built before 1940, researchers divided the total number of housing units built in 1939 or earlier by the total number of existing housing units. The data includes all housing unit types, such as single-family homes, apartments, and condominiums, among others. Locations were ordered by the share of housing units built before 1940. In the event of a tie, the location with the greater number of total housing units built before 1940 was ranked higher. Statistics on when the structure was originally built come from the U.S. Census Bureau 2019 American Community Survey. Home price statistics come from the Zillow Home Value Index.
Only cities with at least 100,000 residents and available data from both sources were included. Cities were also grouped into cohorts based on population size to improve relevance: large (350,000 or more), midsize (150,000–349,999), and small (less than 150,000).
