
By David Heacock
Compared to prior generations, millennials—defined by the Pew Research Center as people born between 1981 and 1996—are known to be better educated, more likely to live in big cities, and more likely to delay marriage and start families. While they have also had lower homeownership rates than older generations of the same age, millennial home buying is picking up steam. Home demand has surged during the COVID-19 pandemic, and many aging millennials are now in a better position to buy a home. According to the most recent granular data on homeownership from the U.S. Census Bureau, the millennial homeownership rate—specifically for those between 23 and 38 years of age in 2019—was 41.9%.
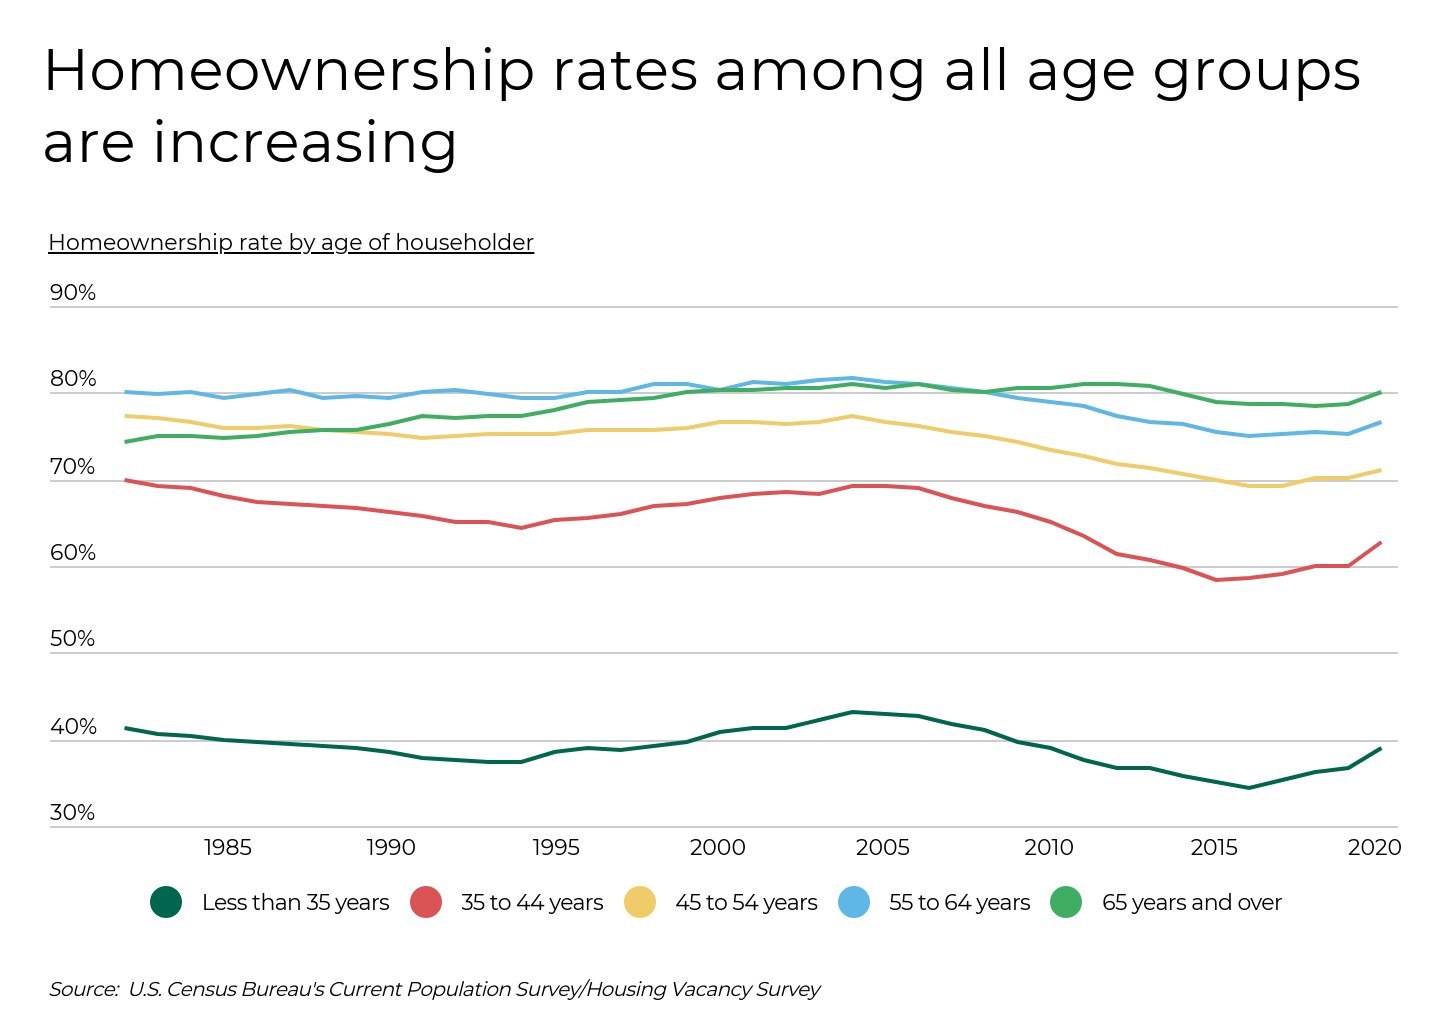
Homeownership rates have been rising across all age groups since 2017, after dipping in the wake of the Great Recession and housing market crash. But unlike during the last economic recession, homeownership rates have only surged higher since COVID-19 began. Fueled by record low interest rates, increased savings rates, and a desire for more space, the overall U.S. homeownership rate jumped by more than two percentage points between 2019 and 2020. For homeowners under 35, which includes most millennials, the homeownership rate grew by even more, from 36.7% in 2019 to 39.1% in 2020.
As it pertains to homeownership, millennials represent a more diverse group of individuals than do older generations because of their younger age. The millennial generation includes both individuals who recently graduated college and also those who have accumulated a decade or more of work experience. While younger millennials—many of whom have student loan debt and are not married—may not yet be considering a home purchase, older millennials have entered prime homebuying years. As such, age is an especially strong determinant of homeownership for millennials.
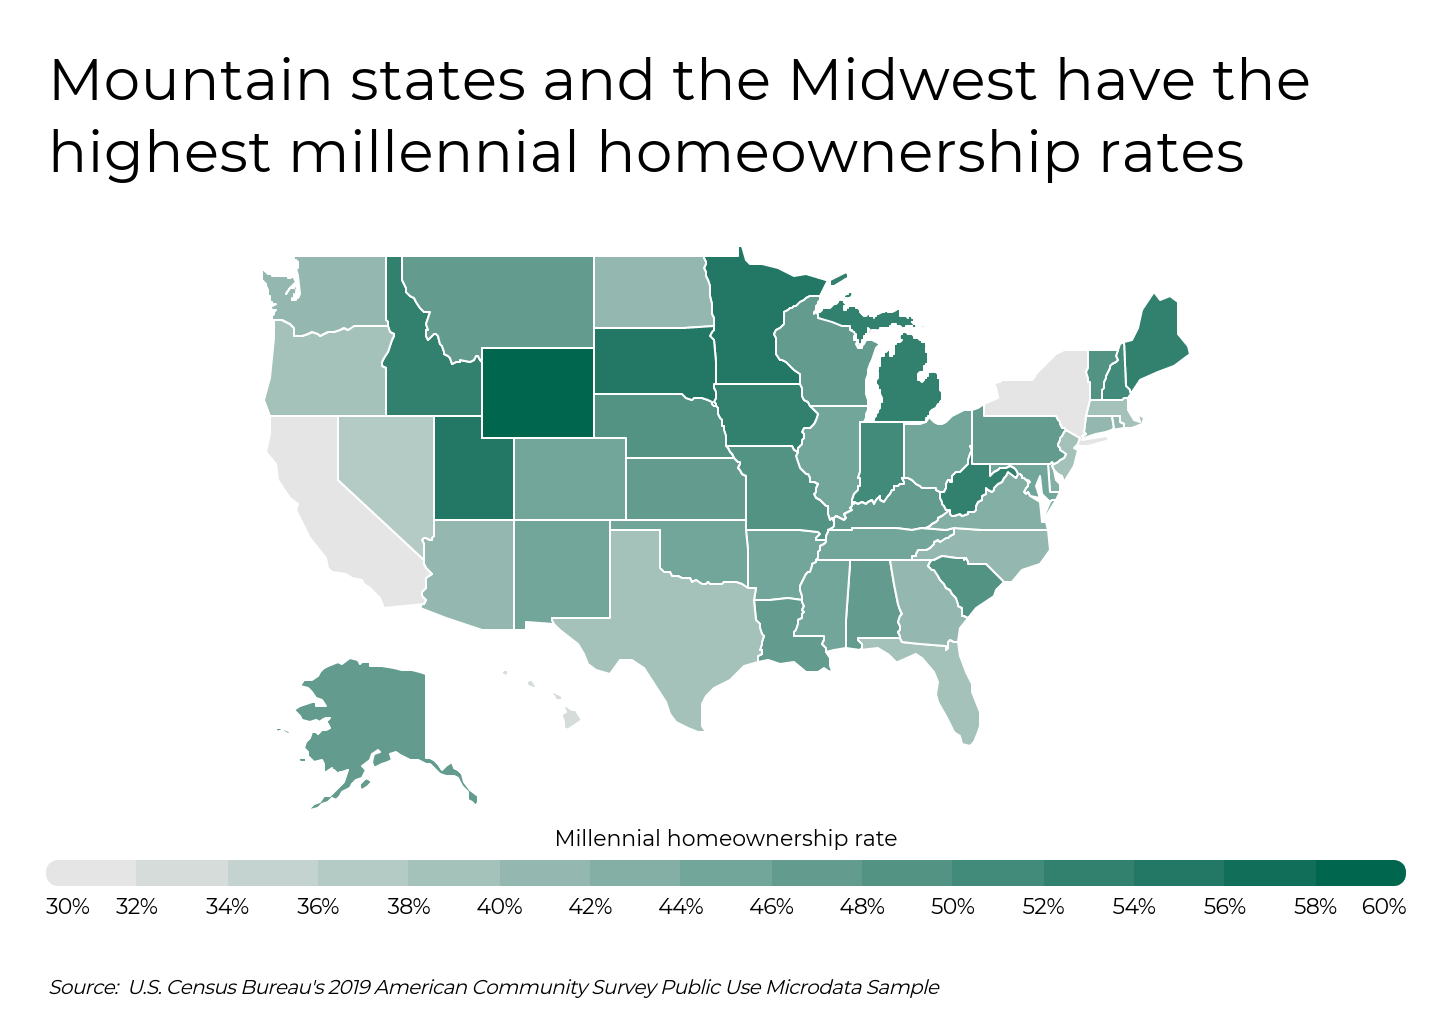
In addition to age, millennial homeownership rates vary substantially by location, largely depending on home prices, local job market conditions, and other cultural factors. On a regional level, the Mountain states and the Midwest have the highest rates of millennial homeownership. Wyoming and Minnesota have the highest millennial homeownership rates in the country, at 59.4% and 55.1%, respectively. At less than $280,000, Wyoming’s median home price is lower than the national median of $303,000, and millennial median income in Wyoming is about the same as the national median. Conversely, California, which is home to some of the most expensive housing in the country, has the lowest rate of millennial homeownership, at just 30%. Other states with above average home prices and low millennial homeownership rates include New York, Hawaii, Nevada, and Massachusetts.
RELATED Replacing your home air filters regularly can dramatically improve the air quality in your home. If you are dealing with particularly problematic conditions—like wildfire smoke or smog—consider using Filterbuy’s MERV 13 air filters.
To find the metropolitan areas with the highest millennial homeownership rates, researchers at Filterbuy analyzed the latest data from the U.S. Census Bureau and Zillow. The researchers ranked metro areas according to the rate of ownership among millennial householders. Researchers also calculated the median income for millennials, median home price, millennial income as a percentage of home price, and the millennial population share. To improve relevance, only metropolitan areas with at least 100,000 people were included in the analysis. Additionally, metro areas were grouped into cohorts based on population.
Here are the metros with the highest millennial homeownership rates.
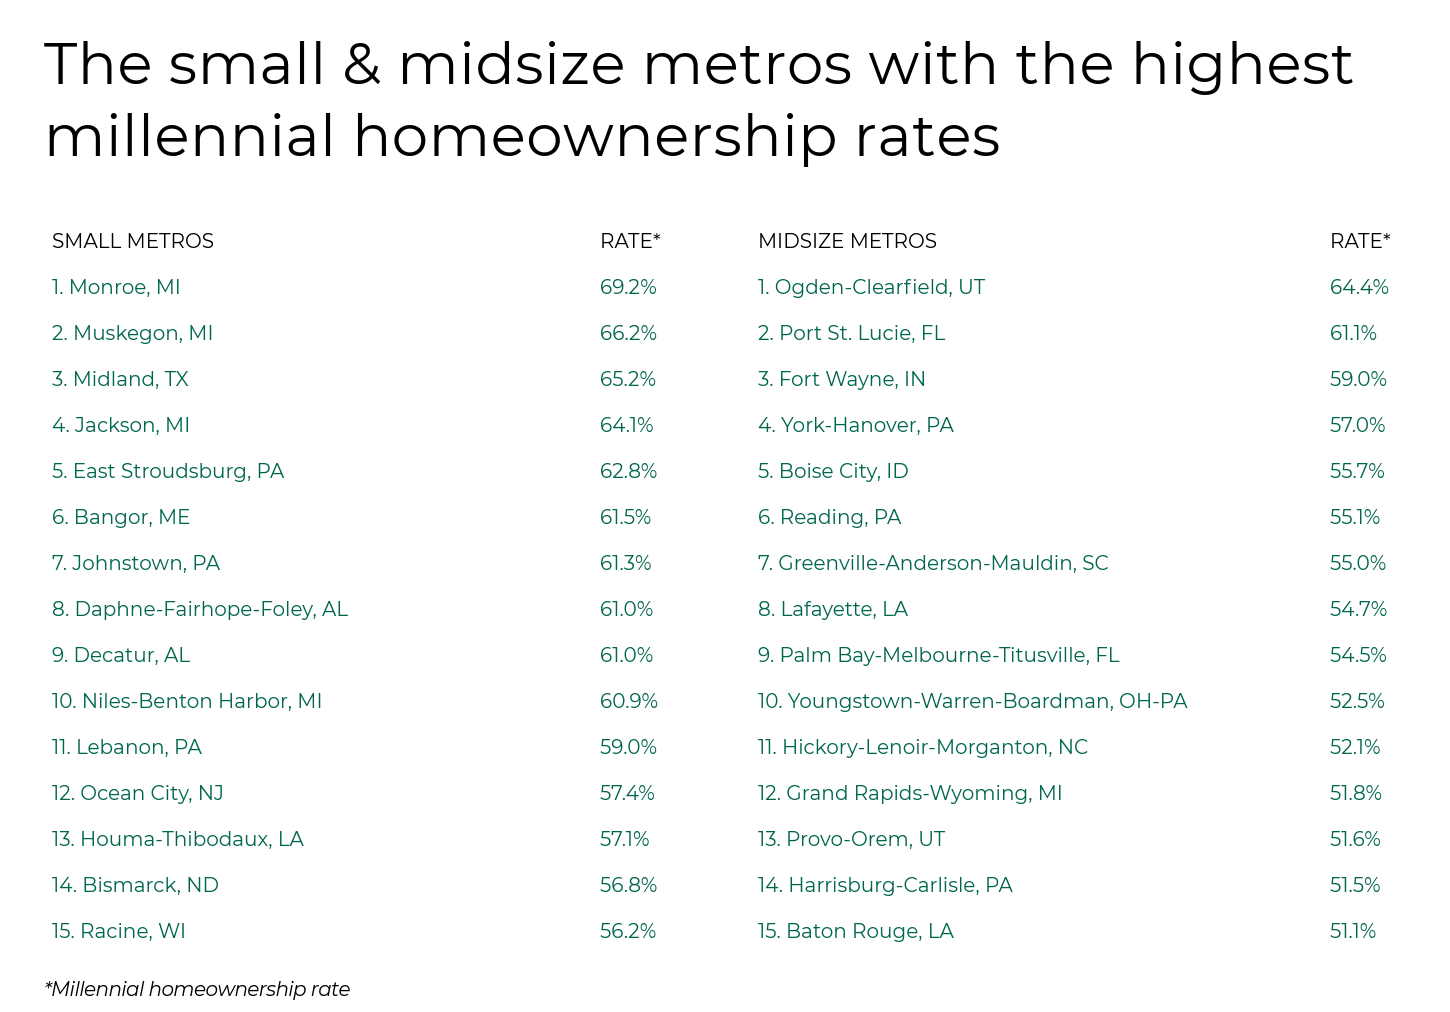

Photo Credit: Sean Pavone / Shutterstock
Millennial homeownership rate: 44.6%
Median income for millennials: $37,000
Median home price: $187,885
Millennial income as a percentage of home price: 19.7%
Millennial population share: 22.8%

Photo Credit: Wirestock Creators / Shutterstock
Millennial homeownership rate: 44.7%
Median income for millennials: $38,000
Median home price: $194,665
Millennial income as a percentage of home price: 19.5%
Millennial population share: 21.2%

Photo Credit: Sean Pavone / Shutterstock
Millennial homeownership rate: 45.5%
Median income for millennials: $40,000
Median home price: $253,659
Millennial income as a percentage of home price: 15.8%
Millennial population share: 21.9%

Photo Credit: Sean Pavone / Shutterstock
Millennial homeownership rate: 45.6%
Median income for millennials: $43,050
Median home price: $347,014
Millennial income as a percentage of home price: 12.4%
Millennial population share: 22.6%

Photo Credit: Agnieszka Gaul / Shutterstock
Millennial homeownership rate: 45.8%
Median income for millennials: $38,000
Median home price: $229,575
Millennial income as a percentage of home price: 16.6%
Millennial population share: 22.6%

Photo Credit: Sean Pavone / Shutterstock
Millennial homeownership rate: 46.3%
Median income for millennials: $42,000
Median home price: $199,145
Millennial income as a percentage of home price: 21.1%
Millennial population share: 21.2%

Photo Credit: Sean Pavone / Shutterstock
Millennial homeownership rate: 47.0%
Median income for millennials: $35,000
Median home price: $206,767
Millennial income as a percentage of home price: 16.9%
Millennial population share: 20.9%

Photo Credit: Agnieszka Gaul / Shutterstock
Millennial homeownership rate: 47.0%
Median income for millennials: $40,000
Median home price: $232,065
Millennial income as a percentage of home price: 17.2%
Millennial population share: 21.2%

Photo Credit: Sean Pavone / Shutterstock
Millennial homeownership rate: 47.3%
Median income for millennials: $38,000
Median home price: $356,137
Millennial income as a percentage of home price: 10.7%
Millennial population share: 23.2%

Photo Credit: Sean Pavone / Shutterstock
Millennial homeownership rate: 49.3%
Median income for millennials: $36,000
Median home price: $215,947
Millennial income as a percentage of home price: 16.7%
Millennial population share: 21.3%

Photo Credit: f11photo / Shutterstock
Millennial homeownership rate: 49.4%
Median income for millennials: $36,000
Median home price: $223,461
Millennial income as a percentage of home price: 16.1%
Millennial population share: 21.5%

Photo Credit: DomVisuals / Shutterstock
Millennial homeownership rate: 49.7%
Median income for millennials: $40,000
Median home price: $240,869
Millennial income as a percentage of home price: 16.6%
Millennial population share: 22.1%

Photo Credit: f11photo / Shutterstock
Millennial homeownership rate: 50.2%
Median income for millennials: $40,000
Median home price: $218,878
Millennial income as a percentage of home price: 18.3%
Millennial population share: 21.4%

Photo Credit: IVY PHOTOS / Shutterstock
Millennial homeownership rate: 51.2%
Median income for millennials: $45,000
Median home price: $350,110
Millennial income as a percentage of home price: 12.9%
Millennial population share: 23.0%

Photo Credit: Sean Pavone / Shutterstock
Millennial homeownership rate: 51.4%
Median income for millennials: $38,000
Median home price: $532,411
Millennial income as a percentage of home price: 7.1%
Millennial population share: 25.7%
To find the metropolitan areas with the highest millennial homeownership rates, researchers at Filterbuy analyzed the latest data from the U.S. Census Bureau’s 2019 American Community Survey Public Use Microdata Sample (ACS PUMS) and Zillow’s most recent Zillow Home Value Index (ZHVI), a measure of typical home value. The researchers ranked metro areas according to the millennial homeownership rate. In the event of a tie, the metro with the larger number of millennial homeowners was ranked higher. Researchers also used the ACS PUMS to calculate the median income for millennials (including both full-time and part-time workers) and the millennial population share. Median home price was calculated from Zillow’s ZHVI and millennial income as a percentage of home price was calculated as median income for millennials as a share of median home price.
To improve relevance, only metropolitan areas with at least 100,000 people were included in the analysis. Additionally, metro areas were grouped into the following cohorts based on population size:
Small metros: 100,000-349,999
Midsize metros: 350,000-999,999
Large metros: more than 1,000,000
