Shop by
What's really floating through Kentucky's air right now? Our live AQI map shows you—because the pollutants you can't see are often the ones causing the most harm to your family and your HVAC system.
After manufacturing filters for over a decade and analyzing thousands of used filters returned from Kentucky homes, we've noticed distinct patterns: Louisville residents consistently send back filters caked with urban particulate matter, while homes near industrial corridors show elevated chemical residue. Eastern Kentucky filters often reveal seasonal spikes from wood-burning and regional ozone events. These aren't just numbers on a map—they're what's actually cycling through Kentucky homes every day.
This page tracks real-time air quality across the Bluegrass State and connects what's happening outside to what matters most: protecting the air your family breathes indoors.
Kentucky's live AQI map displays real-time air quality readings from EPA monitoring stations across the state, updated hourly. The color-coded scale ranges from Green (0-50, good) to Maroon (301+, hazardous).
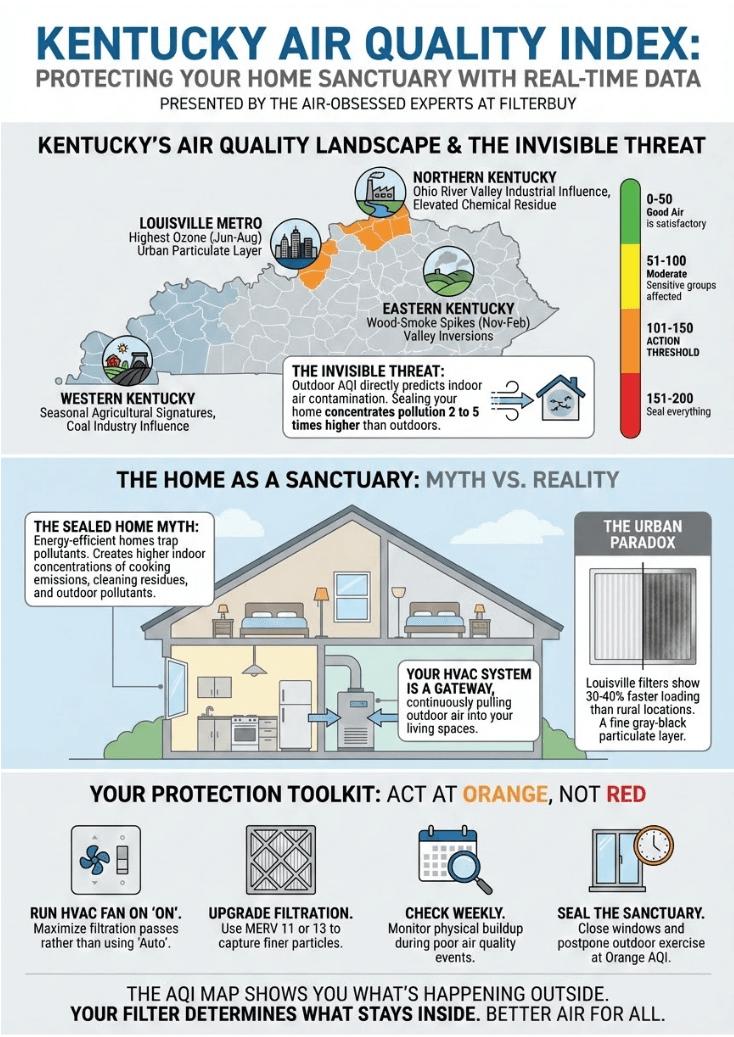
What makes Kentucky's AQI patterns unique:
Louisville Metro: Highest ozone levels, especially June-August
Eastern Kentucky: Wood-smoke spikes November-February
Northern Kentucky: Ohio River Valley industrial corridor influence
Western Kentucky: Seasonal agricultural and coal industry signatures
Why this matters for your home:
After examining thousands of returned filters from Kentucky households, we've confirmed that outdoor AQI directly predicts indoor air contamination. Filters from homes during Orange+ AQI periods show 20-40% heavier particulate loading than identical homes during Green periods.
Outdoor AQI predicts indoor contamination. Elevated outdoor readings → heavier indoor particulate loading. Your home isn't sealed from what's happening outside.
Act at Orange, not Red. Families responding at Orange maintain significantly cleaner indoor air. Waiting for Red means your HVAC has already cycled through hours of polluted air.
Kentucky regions have distinct signatures. Louisville: urban combustion. Eastern Kentucky: wood-smoke during heating season. Northern Kentucky: Ohio River Valley industrial influence. A "Yellow" reading means different things depending on the location.
Indoor air concentrates to 2-5x outdoor levels. Sealed homes trap pollutants entering through HVAC and building gaps. Dirtiest returned filters often come from customers who never open windows.
The map tells half the story. Live AQI shows what's outside right now. Your filter reveals what made it inside—and into your family's lungs.
It measures five major pollutants regulated under the Clean Air Act: ground-level ozone, particulate matter (PM2.5 and PM10), carbon monoxide, sulfur dioxide, and nitrogen dioxide.
What the colors mean:
Green (0-50): Air quality is satisfactory with minimal risk
Yellow (51-100): Acceptable for most, though unusually sensitive individuals may experience mild effects
Orange (101-150): Sensitive groups, including children, seniors, and those with respiratory conditions, should limit prolonged outdoor exposure
Red (151-200): Everyone may begin experiencing health effects; sensitive groups face increased risk
Purple (201-300): Health alert—entire population likely affected
Maroon (301+): Emergency conditions requiring immediate protective action
Here's something many homeowners don't realize: your HVAC system continuously pulls outdoor air into your home. When the AQI rises, those pollutants cycle through your ductwork, past your air filter, and into your living spaces.
During elevated air quality index days, your air filter works significantly harder. A filter that typically lasts 90 days under normal conditions may become saturated in half that time during prolonged poor air quality events. We recommend checking your filter more frequently when your local AQI consistently reads Yellow or higher.
Practical steps when Kentucky's AQI is elevated:
Keep windows and doors closed to prevent unfiltered outdoor air from entering. Run your HVAC fan continuously to maximize filtration passes through your system. Consider upgrading to a higher MERV-rated filter if your area experiences frequent air quality advisories—MERV 11 or MERV 13 filters capture finer particles that lower-rated filters miss. Check your filter's condition weekly during poor air quality periods rather than waiting for your usual replacement schedule.
Kentucky's air quality follows predictable seasonal rhythms that informed residents can anticipate and prepare for.
Spring brings elevated pollen counts that don't directly affect AQI readings but compound respiratory stress when combined with moderate pollution levels. Tree pollen in March and April transitions to grass pollen through early summer.
Summer typically sees Kentucky's highest ozone levels. Hot, sunny days with stagnant air create conditions for ground-level ozone formation, particularly in urban areas. July and August historically record the most Air Quality Alert days statewide.
Fall generally offers Kentucky's cleanest air, though agricultural burning and early heating season can create localized spikes. This transitional period provides an ideal window for HVAC maintenance before winter demands.
Winter introduces heating-related pollutants, particularly in areas relying on wood-burning stoves and fireplaces. Temperature inversions can trap pollutants close to ground level for extended periods, especially in valley communities throughout Eastern Kentucky.

When readings jump to Orange territory and above, sensitive family members - children, elderly relatives, pregnant women, and people with asthma and/or cardiovascular conditions - should avoid outdoor activity as much as possible.
Creating a clean air refuge in your home offers protection at any time, regardless of the external condition of the air. Your filter is your first line of defense, but only if you maintain it properly and correctly rate it for your air quality issues.
"After examining thousands of filters returned from Kentucky homes, we can often identify the region just by looking—Louisville filters show distinct urban particulate signatures, Eastern Kentucky filters reveal wood-smoke patterns during heating season, and that visible evidence confirms what the AQI data tells us: outdoor air quality directly determines what accumulates inside your home and your lungs."
— Filterbuy Air Quality Team
These seven resources are the same tools we point our own Kentucky customers toward when they ask how to protect their families.
This EPA resource gives you the official AQI readings for every monitored location across Kentucky. We check it ourselves when analyzing regional patterns in the filters that customers return to us.
Resource: https://www.airnow.gov/state/?name=kentucky
Kentucky's Division for Air Quality tracks all six criteria pollutants and publishes trend data showing how your region's air has changed over time. Knowledge is power when you're protecting your family.
Resource: https://eec.ky.gov/Environmental-Protection/Air/Pages/default.aspx
This resource provides hyper-local readings from monitors throughout the metro area—the kind of granular data that helps explain why filters from certain neighborhoods show distinct particulate patterns.
Resource: https://airqualitymap.louisvilleky.gov/
Here's something many Kentucky homeowners don't realize: wildfire smoke from hundreds of miles away can significantly impact your local air quality. When we see unexpected spikes in filter buildup across Kentucky, we often trace it back to smoke events visible on this map.
Resource: https://fire.airnow.gov/
Sign up here for free email or text alerts, and you'll know before unhealthy conditions arrive. That warning gives you time to adjust your plans and protect sensitive family members.
Resource: https://www.enviroflash.info/
This comprehensive report grades every Kentucky county on ozone and particle pollution. It's eye-opening reading—and it helps you understand which communities face the greatest challenges and who's most at risk in your household.
Resource: https://www.lung.org/research/sota
For Louisville-area families, this local agency provides daily forecasts, alert announcements, and practical guidance on protecting your health during elevated AQI days. They understand the unique geography and pollution sources affecting the metro area.
Resource: https://louisvilleky.gov/government/air-pollution-control-district
After manufacturing filters for over a decade and serving more than two million households, we've developed insights that only come from hands-on experience. Here's what we've observed—and what authoritative research confirms.
Customers often ask why their filters look so dirty even though they rarely open windows. The answer surprises most people: sealing up your home doesn't protect you from pollution. It concentrates it.
What we see on returned filters from tightly sealed Kentucky homes:
Heavier particulate loading than filters from older, draftier houses
Trapped cooking emissions, cleaning product residue, and pet dander with nowhere to go
Outdoor pollutants are pulled in by HVAC systems, adding to the accumulation
What the research confirms:
The EPA reports that Americans spend approximately 90% of their time indoors, where pollutant concentrations are often 2 to 5 times higher than outdoor levels. Those most vulnerable—young children, older adults, and people with respiratory conditions—spend even more time inside.
Your home isn't a bubble. It's a container that concentrates whatever gets inside.
Source: U.S. Environmental Protection Agency, Report on the Environment: Indoor Air Quality https://www.epa.gov/report-environment/indoor-air-quality
We knew Louisville had an air quality problem long before official rankings confirmed it. The evidence arrived monthly in returned filters.
Distinct patterns we observe in Jefferson County filters:
Fine gray-black particulate layer characteristic of urban combustion
Heavier loading during the summer ozone season
Filter lifespan reduced by 30-40% compared to rural Kentucky locations
More "why is my filter dirty already?" calls than any other Kentucky region
What the research confirms:
The American Lung Association's 2025 "State of the Air" report found that 156 million Americans (46% of the population) live in areas with failing air quality grades. Jefferson County earned an F for ozone pollution.
Our recommendation for Louisville families:
Check filters more frequently from June through August
Consider upgrading to MERV 11 or MERV 13 filtration
Monitor local AQI during the summer ozone season
The filters don't lie. Louisville's outdoor air quality directly determines what accumulates inside your home.
Source: American Lung Association, 2025 State of the Air Report https://www.lung.org/media/press-releases/state-of-the-air-2025
Our most detailed conversations happen with Kentucky customers managing asthma or allergies. Their observations have taught us as much as any laboratory study.
Patterns these families report:
Symptoms worsen during elevated AQI days and seasonal transitions
Filters show heavier biological loading (pollen, mold spores, fine particulates)
Upgrading from MERV 8 to MERV 11 or 13 often reduces symptom frequency
Some can predict bad air days by watching their child's breathing before checking forecasts
What the research confirms:
CDC data shows approximately 25 million Americans (7.7% of the population) currently have asthma. Documented triggers include dust mites, mold, pet dander, and particulate matter—all substances we routinely find embedded in returned filters. Kentucky's asthma rates rank among the highest nationally.
What customers tell us after improving filtration:
Children sleeping through the night without wheezing
Reduced rescue inhaler use
Peace of mind from taking visible action against an invisible threat
Source: Centers for Disease Control and Prevention, Most Recent National Asthma Data https://www.cdc.gov/asthma/most_recent_national_asthma_data.htm
After examining thousands of filters returned from Kentucky homes, we've formed an opinion that might surprise you.
The AQI map you're looking at tells only half the story.
Assumption #1: "If the AQI is green, my indoor air is fine."
Reality: Green outdoor readings don't guarantee clean indoor air. Cooking, cleaning, pets, and off-gassing furniture generate pollutants regardless of outdoor conditions. Some of our dirtiest returned filters come from areas with consistently good AQI.
Assumption #2: "Air quality only matters for people with respiratory issues."
Reality: Every filter tells us otherwise. Healthy families may not feel immediate symptoms, but the particulates accumulating in their homes—and lungs—are identical. The difference is whether you notice it now or later.
Assumption #3: "Checking the AQI occasionally is enough."
Reality: Conditions change hour by hour. Families maintaining the cleanest indoor air check regularly and respond proactively—closing windows before pollution peaks, running HVAC fans during elevated readings, adjusting maintenance schedules seasonally.
We manufacture filters. We'd benefit if everyone bought the highest MERV rating and replaced it monthly.
Our honest recommendation:
Match filtration strategy to Kentucky's actual air quality patterns—not generic national advice
Monitor the AQI map and adjust seasonally
Check your filter monthly rather than following arbitrary replacement schedules
This Kentucky AQI map page helps you:
Understand what AQI readings actually mean for your household
Recognize regional and seasonal air quality patterns specific to Kentucky
Access the same monitoring tools our team uses daily
Connect outdoor conditions to indoor protection strategies
Take visible action against invisible threats
We're not neutral observers. We manufacture filters and believe proper filtration protects families.
But we also believe:
Education matters more than sales pitches
Honest guidance builds trust
Empowered customers make the best long-term partners
Note your region's current AQI color and trend direction. Rising toward Orange? It's time to act—not wait.
Pull it out and look. If it's gray, clogged, or been in place 60+ days during elevated AQI periods, it's working against you—not for you.
Louisville metro - Consider MERV 11 or MERV 13 for urban particulate and summer ozone
Eastern Kentucky - Upgrade during heating season when wood-smoke spikes hit hardest
Northern Kentucky - Account for Ohio River Valley industrial corridor influence year-round
Free email or text notifications give you advance warning before unhealthy conditions arrive—so you can close windows and adjust before pollutants cycle through your home.
With 600+ sizes available, free shipping, and auto-delivery options that keep replacements arriving right on schedule, protecting your Kentucky home takes less than five minutes.
A: Most EPA monitoring stations report hourly. Data appears on public maps within minutes.
What our filter analysis confirms:
We've correlated AQI timestamps with Kentucky filter returns for years. The patterns are consistent and reliable.
Filters pulled during documented Orange spikes → dramatically heavier loading
Same zip codes during Green periods → normal expected saturation
The correlation between reported AQI and physical filter evidence is unmistakable
A: The EPA provides the official scale. Our decade of filter analysis shows what each level actually deposits in Kentucky homes.
Standard AQI scale:
The scale runs from 0 to 500 across six color-coded categories.
Green (0-50) indicates good air quality with no restrictions.
Yellow (51-100) means moderate conditions where unusually sensitive individuals may notice symptoms.
Orange (101-150) is unhealthy for sensitive groups, including children, the elderly, and those with respiratory conditions.
Red (151-200) is unhealthy for everyone.
Purple (201-300) is very unhealthy, and everyone should avoid outdoor exertion.
Maroon (301+) represents hazardous conditions—a health emergency requiring everyone to stay indoors.
What we actually found:
Tightly sealed, energy-efficient homes showed the heaviest loading during Orange+ events
Pollutants enter but can't escape
The concentration effect occurs regardless of the occupant's health
Drafty older homes sometimes fare better during short spikes—contaminated air doesn't linger
Key insight: AQI categories predict what accumulates inside your home, whether you feel symptoms or not.
A: Geography, industry, and seasonal factors create distinct profiles. We see the physical evidence arrive weekly.
Our unique perspective:
After years of examining returns, our team can often identify a filter's Kentucky region without checking the shipping label.
The insight competitors can't offer:
AQI maps show numbers. We see what those numbers leave behind.
A reading of 75 in rural Eastern Kentucky represents different particulates than 75 in downtown Louisville—even though both display as "Yellow."
A: Act at Orange, not Red. That single habit separates families with clean indoor air from everyone else.
The mistake we see repeatedly:
Customers wait until Red conditions before taking action. By then, HVAC systems have cycled hours of polluted air through their homes.
Response guide based on customer outcomes:
At Yellow (51-100):
Monitor trend—rising toward Orange?
Consider closing windows during the peak afternoon
Check the filter if 60+ days since last inspection
Sensitive households: this is your early warning
At Orange (101-150):
This is your action threshold. Don't wait.
Close windows and exterior doors immediately
Switch the HVAC fan from "auto" to "on."
Keep sensitive family members indoors.
Check filter—Orange accelerates loading significantly
Postpone outdoor exercise until evening
At Red (151+):
Treat it as serious. We've seen filters from Red events that looked months old after just weeks.
Seal everything—windows, doors, gaps
Run HVAC continuously
Minimize everyone's outdoor exposure
Avoid indoor pollutants (gas stoves, candles, aerosols)
Create one "clean air room" if you have a portable purifier
Replace the filter within days of conditions improving
A: This question drives our entire educational approach. A decade of connecting AQI data to filter evidence has shaped our perspective.
The common assumption:
"Closed windows protect me from outdoor air quality."
What our filter analysis proves:
This assumption is demonstrably wrong. We see the evidence constantly.
How outdoor air enters your "sealed" home:
HVAC system pulls air with each cycle—some from outside
Gaps around ductwork and imperfect seals
Bathroom exhaust fans (air flows backward when off)
Kitchen range hoods and dryer vents
Your home breathes whether you want it to or not
This live AQI map shows you what's happening outside—your air filter determines what stays inside. Find the right filter for your Kentucky home and take control of your family's indoor air today.