
San Antonio, TX Live Wildfire Smoke Map
Get Alerts For Wildfires In Your Area
The moment a wildfire starts near you, you'll get an instant alert and simple tips to reduce your smoke exposure.
What's In The Smoke
30xSmaller than a human hair
Fine enough to reach deep into the lungs. A MERV 13 is built to capture it.
How Far It Travels


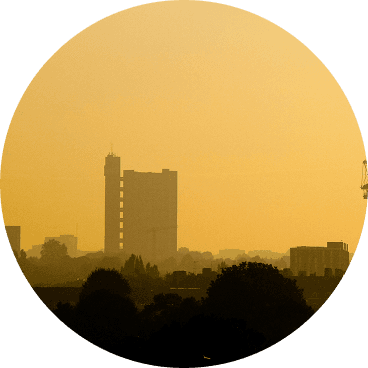
It Doesn't Stay Local
Smoke rides the wind far downwind — you can get smoky air with no fire nearby.
What To Do During A Smoke Event
Simple steps to reduce indoor exposure.
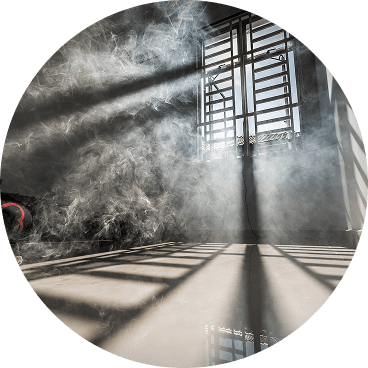
- Stay In, Close UpShut windows and doors to keep smoke out.
- Set Fan To "On"Keeps air cycling through your filter, not just when heating or cooling.
- Recirculate AirSwitch off fresh-air intake so you're not pulling smoke in.
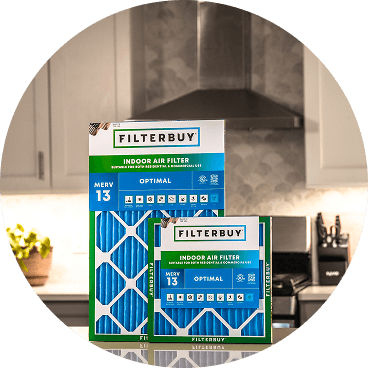
- Run A MERV 13Built to capture the fine PM2.5 in smoke.
- Add A PurifierExtra filtration for the room you use most.
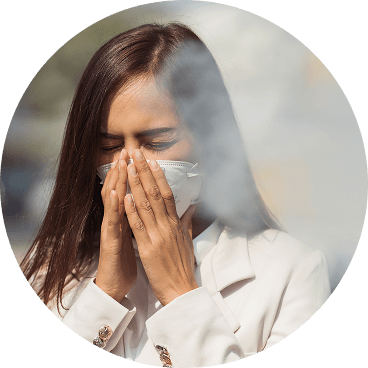
- Wear an N95 if OutsideFits snug to block fine particles — a cloth mask won't.


The Best Air Filter For Wildfire Smoke
During smoke events, the EPA recommends upgrading to a MERV 13 filter — or the highest-rated filter your system can handle — to help reduce the fine particles smoke brings indoors. MERV 13 is the level most home HVAC systems can run while still capturing PM2.5, the fine particulate that makes up the bulk of wildfire smoke.
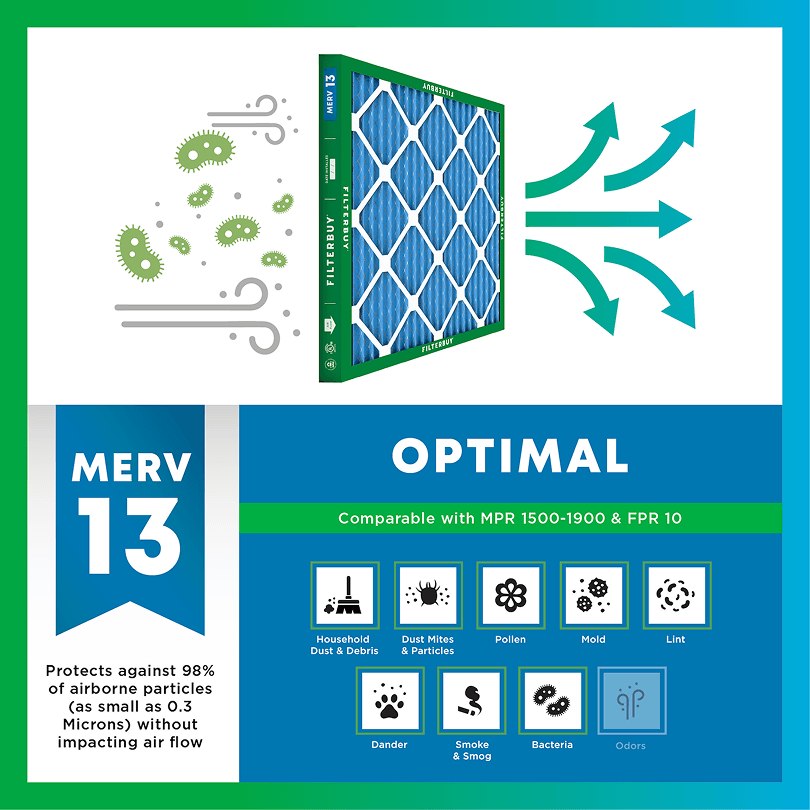

- Captures PM2.5 particles
- Blocks ash, soot, and smoke odor
- Keeps your indoor air safe—even when the outdoor air is dangerous
- Meets the EPA's recommended rating for filtering fine wildfire smoke particles.

Wildfire Smoke FAQs
Facts About Wildfires
Over 70,000 wildfires burn in the U.S. every year.
Wildfire smoke can travel 1,000+ miles, affecting states that aren't even near the blaze.
Exposure to wildfire smoke can worsen asthma, trigger heart issues, and lead to ER visits.
Indoor air can hold more fine particles during wildfire events unless it's properly filtered.
The EPA advises using MERV 13 filters or portable HEPA air cleaners during wildfire smoke events.
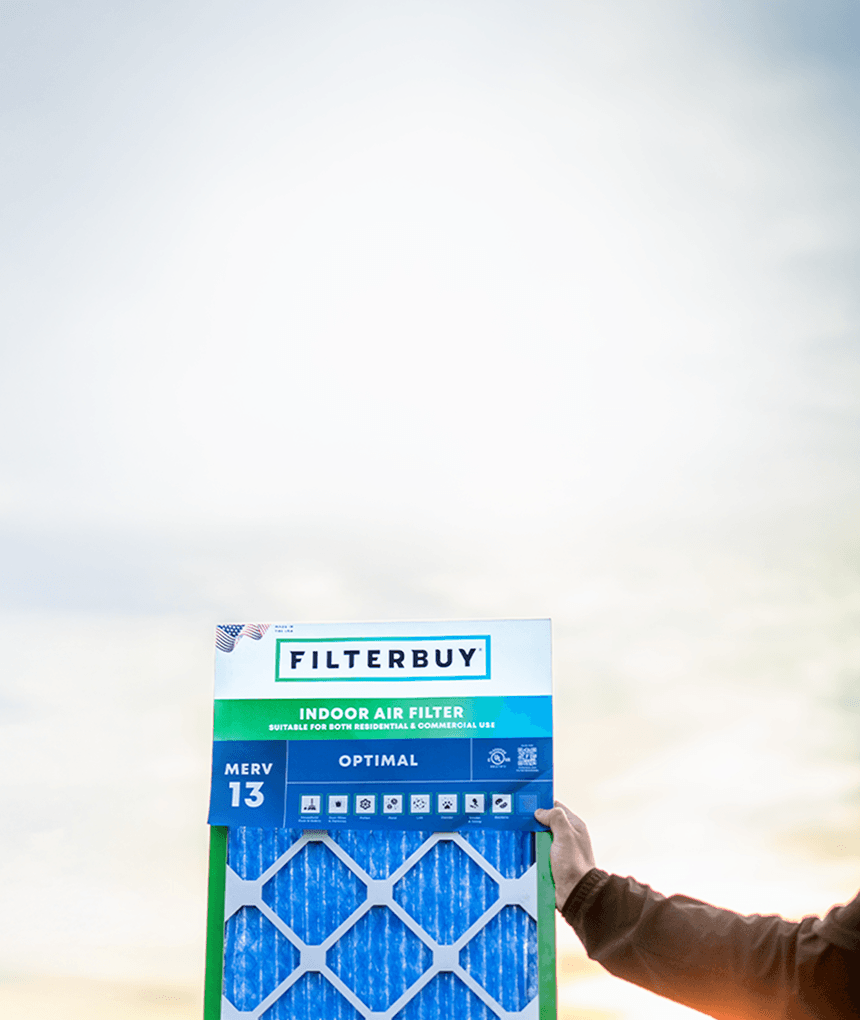
Don't Wait Until The Smoke's Inside.
Use the live wildfire smoke tracker and upgrade your air filters today to protect your lungs and your home.
Shop Filters For Smoke Protection
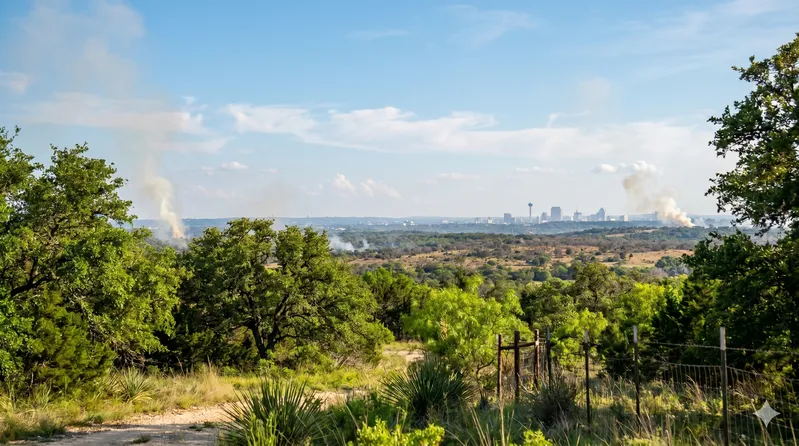
Active Wildfires Near San Antonio Texas Right Now: Are You Safe?
February in Bexar County can look completely calm on a Tuesday and show active fire weather by Thursday. Humidity drops below 15% behind a cold front, northwest winds pick up, and the cedar and juniper brush west of the city becomes fuel. Wildfire smoke does not wait at the city limits.
The map at the top of this page delivers real-time fire detection data, current AQI readings, and satellite-tracked smoke plume coverage for San Antonio and the surrounding Texas region. What follows explains what those readings mean for your home and your HVAC system, including the one protective step most San Antonio homeowners skip until smoke is already inside.
The map shows active fire perimeters, smoke plume coverage, and color-coded AQI zones across Texas. Green = Good, Yellow = Moderate, Orange = Unhealthy for Sensitive Groups, Red = Unhealthy, Purple = Very Unhealthy, Maroon = Hazardous.
TL;DR Quick Answers
Current Live Forest Wildfire and Smoke Map Today in San Antonio, TX
The EPA AirNow Fire and Smoke Map at fire.airnow.gov is the most reliable live source for active wildfires and current smoke conditions near San Antonio, TX. Enter your zip code to see fires within 30 miles of your location, real-time AQI readings for Bexar County, and satellite-tracked smoke plume coverage updated hourly.
What the map shows:
Active fire locations detected by satellite across the Texas Hill Country, West Texas, and surrounding counties
Smoke plume coverage showing where wildfire smoke is currently drifting and at what density
Color-coded AQI readings from Green (Good) through Maroon (Hazardous) at monitoring stations across the San Antonio metro area
Health action guidance based on your specific location's current air quality reading
What to do when San Antonio AQI hits orange or higher:
Close all windows, doors, and fireplace dampers immediately
Switch your HVAC system to recirculate mode and run the fan continuously
Confirm your air filter is rated MERV 13 or higher — the minimum threshold for meaningful PM2.5 wildfire smoke capture
Check the map again every few hours; San Antonio AQI can shift two to three categories within a single afternoon during active smoke transport events
Wildfire smoke does not stop at the city limits. Fires burning in Val Verde, Edwards, Kerr, and Kendall counties can push unhealthy air into Bexar County within hours. The live map tells you what's burning. Your MERV 13 air filter is what protects your family while it burns.
Top Takeaways
Wildfire smoke can reach San Antonio from fires burning in the Hill Country, West Texas, and the Trans-Pecos region, even when no fire is burning in Bexar County itself.
PM2.5 particles in wildfire smoke are smaller than 2.5 microns. They move through most homes and bypass standard MERV 4 to MERV 8 air filters without meaningful capture.
Any AQI reading above 150 (Red) means everyone, not just sensitive groups, should reduce outdoor exposure and prioritize indoor air quality.
Running your HVAC fan continuously on recirculate during a smoke event turns your air handler into a filtration loop. This step costs nothing extra and requires no equipment beyond the system already in your home.
MERV 13 is the minimum filter rating for meaningful PM2.5 wildfire smoke capture. Filters rated below MERV 13 won't provide adequate protection during active smoke events.
The live Texas wildfire tracker above updates in real time. During active fire weather seasons, spring and fall, San Antonio residents should monitor AQI daily, not reactively.
What San Antonio Residents Need to Know Right Now
Fine particle pollution from a wildfire in Val Verde County can push San Antonio's AQI into dangerous territory before most residents smell smoke. The fire doesn't have to be close. It has to be upwind.
How Wildfire Smoke Reaches San Antonio
West of San Antonio, the Hill Country's cedar flats, juniper breaks, and dry scrubland rank among the most fire-prone landscapes in the southern United States. South and southeast winds, which are common across Central Texas in spring and fall, carry smoke from fires in Val Verde, Edwards, Kerr, and Kendall counties into the metro area within hours. When fire activity spikes across West Texas or the Trans-Pecos, upper-level winds push those plumes even farther east across Bexar County.
The smoke map above reflects these plume movements in real time, pulling from satellite data and the EPA's national monitoring network. AQI readings update hourly. During active wildfire events, conditions can shift from Moderate to Unhealthy in a single afternoon.
How to Read the AQI Scale for Wildfire Events
The Air Quality Index runs from 0 to 500. For wildfire smoke, PM2.5 drives the number: fine particulate matter smaller than 2.5 microns in diameter. Those particles stay suspended in air for days and reach deep into lung tissue.
0 to 50 (Green — Good): No action needed for most people.
51 to 100 (Yellow — Moderate): Unusually sensitive individuals should consider limiting prolonged outdoor exertion.
101 to 150 (Orange — Unhealthy for Sensitive Groups): Children, older adults, and those with asthma or heart disease should reduce outdoor time.
151 to 200 (Red — Unhealthy): Everyone should reduce outdoor exertion. Stay indoors when possible.
201 to 300 (Purple — Very Unhealthy): Serious health effects are possible. Remain indoors with windows and doors closed.
301 and above (Maroon — Hazardous): Health emergency conditions. Avoid all outdoor activity.
What MERV Rating Filters Wildfire Smoke
Standard 1-inch home air filters, typically MERV 4 to MERV 8, are designed for dust and pollen. PM2.5 particles are far smaller than what those ratings address. After manufacturing filters for over a decade and serving more than two million households, we know that wildfire smoke events reveal the performance gap between a standard filter and one rated MERV 13 or higher.
A MERV 13 filter captures a minimum of 85% of particles in the 1 to 3 micron range, which puts it in meaningful range against PM2.5 smoke particles. Upgrading to MERV 13 and running your HVAC fan continuously, even without heating or cooling, turns your home's air handler into an active filtration loop.
How to Protect Your Home During a Smoke Event
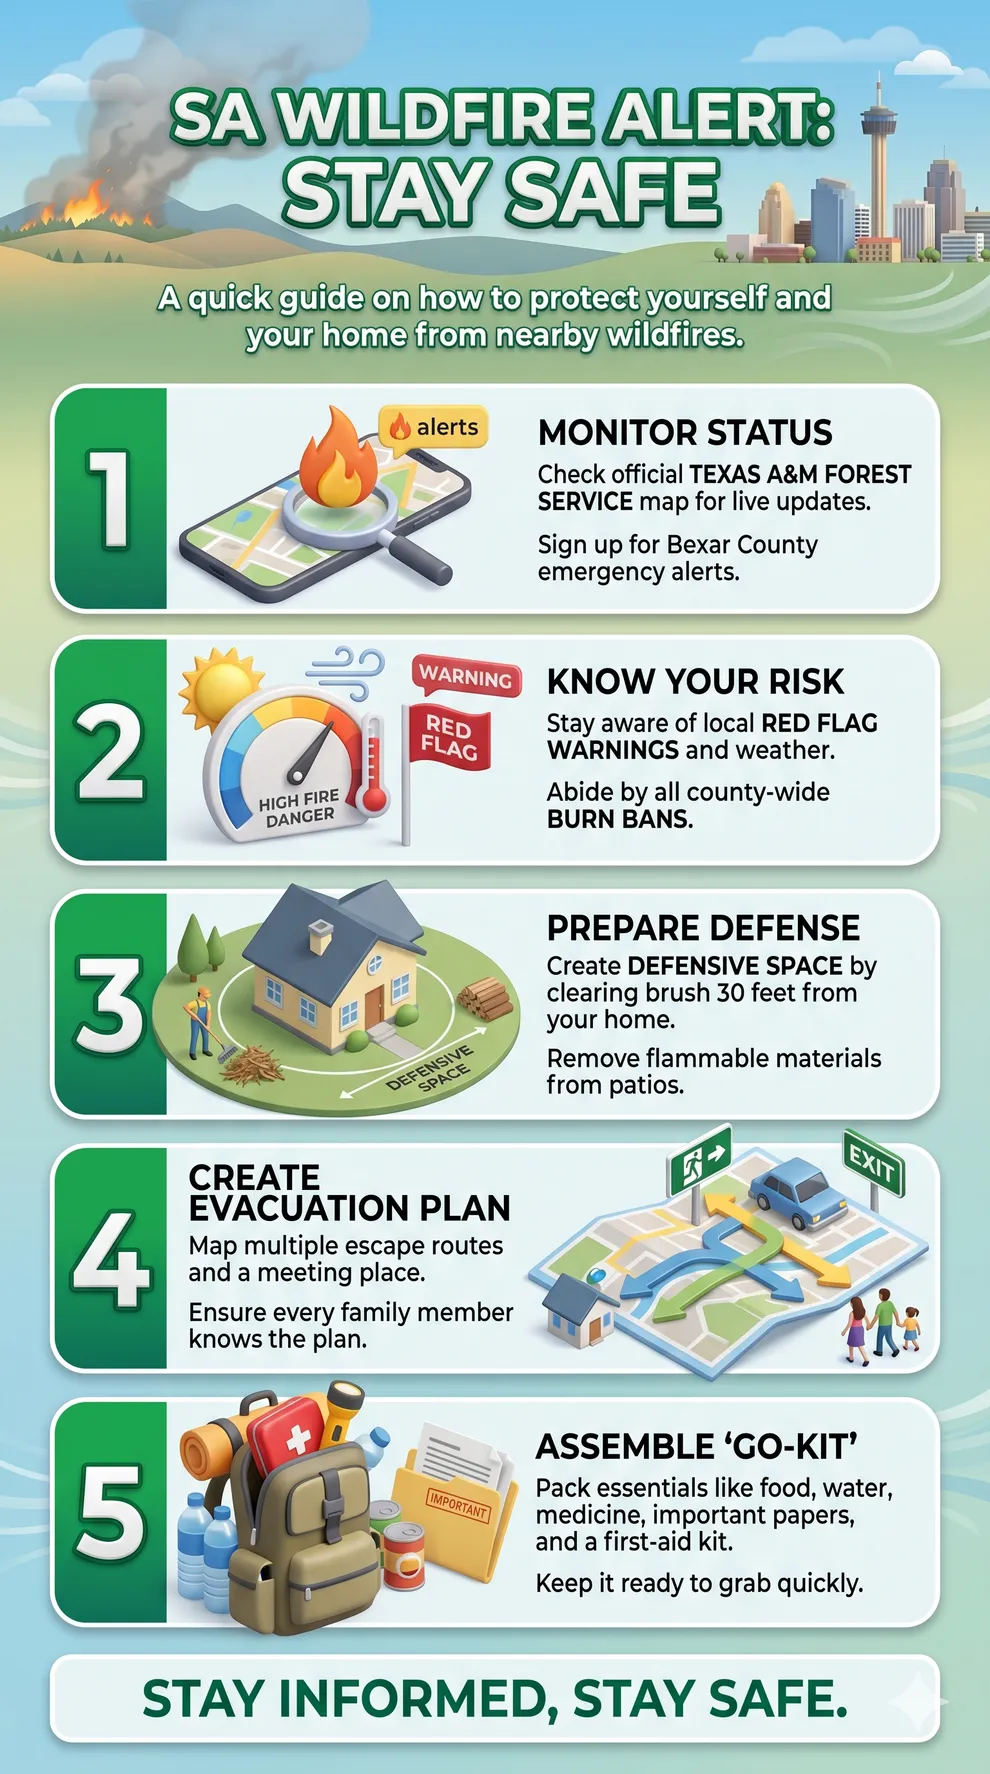
During a wildfire smoke alert, your job is to cut off the outdoor air coming in and keep filtering what's already inside. These steps have the greatest impact:
Close all windows, doors, and fireplace dampers. Reducing infiltration pathways is the first priority.
Set your HVAC system to recirculate mode and run the fan continuously. This keeps air cycling through your filter instead of pulling it in from outside.
Verify or upgrade your air filter. A filter rated MERV 13 or higher is the threshold for meaningful PM2.5 capture. Filters below that rating will not provide adequate protection during heavy smoke events.
When San Antonio Wildfire Risk Is Highest
Fire weather conditions in Bexar County and the broader Hill Country region peak during two windows: late winter through spring (February through April), when low humidity and dry northwest winds follow cold fronts, and again in fall (October through November), when seasonal drought and elevated temperatures dry out residual vegetation. In years following below-average rainfall, either window can run long.
The Texas wildfire tracker above reflects current fire activity across the state. During high-risk periods, check the live San Antonio smoke map daily. AQI conditions near wildfires can change in a matter of hours.
"We see it every fire season: homeowners close the windows and assume the air inside is safe. What they don't realize is that wildfire smoke particles are small enough to infiltrate most homes even with everything shut, and a standard 1-inch filter is not designed to stop them. During a smoke event, the filter in your HVAC system is either working for you or it's not working at all."
7 Essential Resources for San Antonio Wildfire Smoke Awareness
No single source gives you the full picture during a wildfire smoke event. Fire perimeters shift, plume coverage changes, and AQI readings can jump multiple categories in a few hours. These seven federal and state resources cover the gaps — each verified live in April 2026.
Track Real-Time Fire Locations and Smoke Levels Across Texas
The EPA AirNow Fire and Smoke Map gives you PM2.5 data from over 1,700 air quality monitors, satellite-detected smoke plumes, and quality-controlled low-cost sensor readings from nearly 15,000 PurpleAir sensors in a single interface. Enter your San Antonio zip code and the map identifies fires burning within 30 miles of your location, shows your localized AQI, and gives you recommended health actions based on current conditions.
Version 4 of the map, released in September 2025 through a joint EPA and USDA Forest Service partnership, loads faster and includes updated mobile and desktop interfaces. Smoke Forecast Outlooks for larger fires are prominently linked when available, giving residents a multi-day smoke projection rather than just a current snapshot. The map also now flags coarse particle pollution and ozone data, both of which can rise during wildfire events independent of PM2.5.
For San Antonio residents, this is the starting point. Check the color-coded AQI at your location, look for nearby fire icons, and use the dashboard popup to see how air quality has trended over the prior week. The EPA also offers a free AirNow mobile app for Android and iOS that pushes notifications when AQI in your saved locations crosses alert thresholds.
Source: fire.airnow.gov
View Active Fire Perimeters Detected by Satellite Across the U.S. and Texas
The USDA Forest Service Active Fire Mapping Program is operated by the Geospatial Technology and Applications Center (GTAC) in Salt Lake City, Utah. It uses satellite imagery from NASA's FIRMS (Fire Information for Resource Management System) to detect, characterize, and map wildland fire conditions in near real time across the continental United States, Alaska, Hawaii, and Canada. Every fire detected is mapped regardless of who owns the land — federal, state, tribal, or private.
This resource goes beyond the AirNow Fire and Smoke Map in one important respect: it provides fire characterization, not just fire detection. GTAC analysts describe fire perimeter extent, progression rate, and fire behavior context in the data feeds, giving fire managers and the public a more operational picture of what a fire is doing, not just where it is. For Texas residents, this is the most granular federal source for confirmed fire perimeter data outside of an incident-specific InciWeb page.
The program links directly to the NASA FIRMS mapping tool, where users can zoom into the Texas Hill Country and surrounding counties to view fire detections by date, satellite pass, and detection confidence level. During active wildfire events near San Antonio, the GTAC data often reflects updated perimeter information hours before local media reports are published.
Source: data.fs.usda.gov/geodata/maps/active-fire.php
Monitor Texas Air Quality Data Directly from State Monitoring Stations
The Texas Commission on Environmental Quality runs one of the most extensive air monitoring networks in the country, with over 200 stations spread across the state serving more than 25 million Texans. TCEQ maintains more than double the number of monitors required by federal law, including state-initiative monitors placed in areas of specific local concern. The network measures PM2.5, ozone, sulfur dioxide, benzene, toluene, styrene, 1,3-butadiene, hydrogen sulfide, volatile organic compounds, metals, and carbonyls at different sites across Texas.
TCEQ's GeoTAM Dashboard is the most useful tool for San Antonio residents during a wildfire smoke event. It displays current live ambient air values from TCEQ monitoring sites and partner stations in an interactive geospatial interface, updated hourly. The portal also links to the Texas Air Monitoring Information System (TAMIS), which allows users to download historical hourly and monthly data by site or pollutant. During wildfire events, TCEQ's localized PM2.5 readings reflect San Antonio-specific smoke impact with more precision than national averages, which average across much wider geographic areas.
TCEQ personnel physically visit each monitoring station on a weekly basis to perform quality control checks and preventive maintenance. Instruments undergo daily, weekly, and quarterly calibration audits. This means the data you see on TCEQ's air quality portal carries a quality assurance standard that distinguishes it from crowd-sourced sensor networks. Sign up for TCEQ's free air quality forecast email and text alerts for the San Antonio metro area through the portal.
Source: tceq.texas.gov/airquality/monops
Follow CDC Guidelines on Protecting Your Health from Wildfire Smoke
The Centers for Disease Control and Prevention publishes safety guidelines for wildfire smoke exposure through its National Center for Environmental Health. The guidance is specific, actionable, and directly relevant to what San Antonio homeowners need to know during an active smoke event. The CDC explicitly recommends using high-efficiency HVAC filters rated MERV 13 or higher, closing the fresh-air intake, and setting the system to recirculate mode — the same steps we recommend based on our manufacturing experience.
The guidance covers the full range of protective actions: what to do indoors, how to choose and correctly wear an N95 respirator if you must go outside, how to protect children (ages 2 and older can wear respirators, but fit matters), how to watch for smoke-related health symptoms in household members with asthma, COPD, heart disease, diabetes, or chronic kidney disease, and how to protect pets and livestock. The CDC also addresses power outages, which large fires frequently cause, including carbon monoxide risks from generators and food safety guidance.
The CDC recommends monitoring AQI at airnow.gov and listening to NOAA Weather Radio or the Emergency Alert System for real-time updates during fire events. If you are close to an active fire, the CDC is clear: follow evacuation orders without delay. The guidance also confirms that smoke can linger in the air for days after a fire is contained, so checking AQI after a smoke event ends is just as important as monitoring it while the fire burns.
Source: cdc.gov/wildfires/safety
Track National Wildfire Activity and Preparedness Levels from NIFC
The National Interagency Fire Center in Boise, Idaho coordinates wildland fire response across eight federal agencies and multiple state, tribal, and local partners: the Bureau of Land Management, Bureau of Indian Affairs, National Park Service, U.S. Fish and Wildlife Service, U.S. Forest Service, U.S. Fire Administration, National Association of State Foresters, and the Department of Defense. NIFC's Fire Information hub is the authoritative public source for the current national wildfire situation.
NIFC publishes the Incident Management Situation Report (IMSR) daily during peak fire season. The IMSR provides a nationwide snapshot of active fires, acreage, resource commitment, and conditions at the time of publishing. NIFC also maintains InciWeb, the interagency incident information system where each active wildfire receives its own page with maps, situation updates, evacuation orders, road closures, photos, and public affairs contacts. When fires near San Antonio grow large enough to require an incident management team, InciWeb is where official information appears first.
NIFC's Preparedness Level system runs from 1 (lowest activity, local resources sufficient) to 5 (national resources heavily committed, geographic areas taking emergency measures). As of April 2026, the national preparedness level is PL 1. Historically, the national PL averages 3 in July and 4 in August — the peak of the national fire season. When NIFC escalates the preparedness level to 3 or higher, it signals that national firefighting resources are thinly spread, which can extend response times for new fires in Texas and directly affect containment speed near San Antonio.
Source: nifc.gov/fire-information
Get Current and Forecast AQI Conditions Nationwide from AirNow
EPA's AirNow platform gives you current and forecast AQI readings for cities and zip codes across the United States. While the Fire and Smoke Map focuses specifically on wildfire-related PM2.5, AirNow.gov tracks the full range of criteria pollutants year-round: ozone, PM2.5, PM10, carbon monoxide, sulfur dioxide, and nitrogen dioxide. During wildfire events, smoke can depress surface ozone while simultaneously pushing PM2.5 into hazardous ranges — AirNow captures both in one dashboard, which matters for San Antonio residents managing both seasonal ozone and smoke exposure.
AirNow offers several tools beyond the basic AQI lookup. The EnviroFlash program sends free email or text alerts when AQI in your selected location reaches any threshold you choose, from Moderate through Hazardous. For San Antonio, this means you can set an alert at AQI 101 and receive a notification the moment air quality crosses into the range that affects sensitive groups — without having to check the site manually. The platform also offers AQI widgets and a developer API for organizations that want to embed real-time air quality data into their own websites or apps.
The free AirNow mobile app for Android and iOS stores multiple saved locations and delivers push notifications when AQI crosses thresholds you set. During active wildfire smoke events in Texas, the app is the fastest way for San Antonio residents to check their local AQI at any hour. AirNow also links to state agency air quality pages, including TCEQ, so you can move seamlessly between national-scale data and Texas-specific monitoring.
Source: airnow.gov
Understand How Wildfire Smoke Enters Your Home and What to Do About It
The EPA's wildfire indoor air quality guidance explains the three specific pathways through which smoke infiltrates homes: natural ventilation (open windows and doors), mechanical ventilation (bathroom fans, kitchen exhaust vents, and HVAC fresh-air intakes), and infiltration (smoke seeping through small openings, joints, cracks, and gaps around closed windows and doors). Most homeowners manage the first pathway instinctively. The second and third are what catch people off guard during a wildfire smoke event in San Antonio — and they require specific HVAC and filter actions to address.
Source: epa.gov/emergencies-iaq/wildfires-and-indoor-air-quality-iaq
Supporting Statistics: What the Data Says About Wildfire Smoke in Texas
These three data points put the wildfire smoke threat in concrete terms, particularly for families who assume staying inside is enough.
Wildland fires accounted for 52% of total PM2.5 emissions in the United States, according to EPA's 2020 National Emissions Inventory.
Working with homeowners across Texas and the broader South, we've watched fine particle levels spike inside homes during wildfire events far from the immediate fire zone. That 52% figure means wildfire smoke is the single largest driver of unhealthy air quality days in the U.S. A standard MERV 8 filter is not built for it.
Source: epa.gov/air-research/wildland-fire-research-reducing-exposures
As of mid-April 2026, U.S. wildfires have burned over 1.7 million acres year-to-date, according to the National Interagency Fire Center.
In our experience tracking wildfire smoke impacts on indoor air quality, year-to-date acreage this high by mid-spring signals more fire season ahead, not less. Texas historically sees its most significant wildfire activity in spring and again in the fall dry season. When national acreage runs high by April, the risk window for smoke events in San Antonio and Bexar County stretches meaningfully into summer.
Source: nifc.gov/fire-information/statistics
The EPA Fire and Smoke Map draws continuous PM2.5 data from more than 1,700 state, local, and Tribal air quality monitors nationwide, including Texas-based stations operated by TCEQ.
That density matters most during wildfire events, when smoke levels shift rapidly across short distances. We've seen San Antonio-area readings differ by two or three AQI categories from one side of the metro to the other during active smoke transport events. One ZIP code reading won't tell you what's happening at your address. The live map will.
Source: epa.gov/wildfire-smoke-course/where-find-air-quality-smoke-reports-fire-and-smoke-map
Our Take: Wildfire Smoke Is an Indoor Air Problem Too
Closing the windows and going inside is the right first move. It's just not the complete one.
PM2.5 particles measure smaller than 1/30th the diameter of a human hair. They don't need an open window to get in. They move through gaps around door frames, HVAC fresh-air intakes, plumbing penetrations, and every small imperfection in a building envelope that was never designed to be airtight.
When AQI hits Unhealthy levels in San Antonio during a wildfire smoke event, indoor PM2.5 concentrations in a typical home with a standard MERV 8 filter can approach, and in some cases exceed, outdoor levels within a few hours. That's the invisible reality we think about constantly. For families with children, older adults, or anyone with asthma or cardiovascular conditions, the right filter isn't optional during fire season.
Keep the live wildfire map open when conditions are moving. Your HVAC filter is the primary thing standing between that map and your family's air.
Next Steps: Protect Your Home During a Wildfire Smoke Event
When the San Antonio smoke map shifts toward orange, red, or purple, work through these steps.
Check the live map and your local AQI. Open the EPA AirNow Fire and Smoke Map above, enter your San Antonio zip code, and note the current AQI category and any fire incidents within 30 miles of your location. During active smoke events, check every few hours. Conditions change.
Close all windows, doors, and fireplace dampers. Reducing infiltration pathways is the first priority. Close the fresh-air intake on any HVAC system equipped with one, and switch the system to recirculate mode.
Set your HVAC fan to run continuously. Running the fan, without necessarily heating or cooling, keeps air moving through your filter at all times and turns your home's air handler into an active smoke scrubber. It costs nothing and requires no extra equipment.
Verify your air filter is rated MERV 13 or higher. If your current filter is MERV 12 or below, a standard MERV 8 fiberglass, or any filter you can hold up to light and see through, replace it before AQI reaches Unhealthy levels. A MERV 13 filter provides meaningful capture of PM2.5 wildfire smoke particles. Filters below that threshold do not.
Reduce indoor activities that generate additional particulates. During heavy smoke events, avoid frying, grilling, or burning candles indoors. These add indoor-generated PM2.5 on top of whatever is infiltrating from outside, compounding your exposure.
Frequently Asked Questions
Better Air Starts With the Right Filter
The live map above shows you what's burning and how close it is. Your air filter decides what your family breathes while it burns. During a wildfire smoke event in San Antonio, a MERV 13 or higher filter is the single most actionable step a homeowner can take to reduce indoor PM2.5 exposure. It runs continuously and quietly, every time your HVAC fan cycles on.
If your current filter is rated below MERV 13, or if you can't remember the last time it was changed, now is the time. Find the right MERV 13 filter for your system at Filterbuy.com.